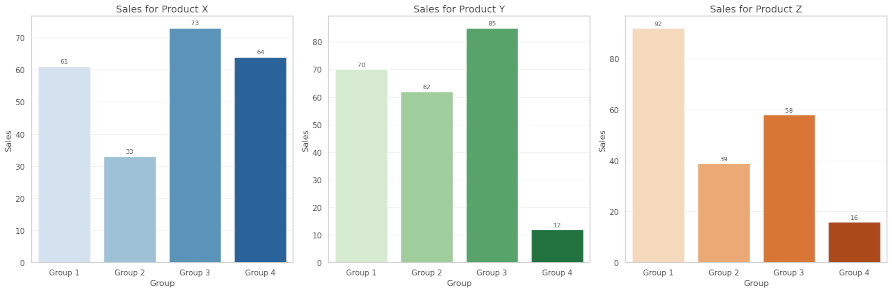
Tag: scatterplot

  • Creating Charts with Python and Seaborn

    Data visualization is a crucial part of understanding and communicating insights from data. Among the many Python libraries available for visualization, Seaborn stands out for its simplicity, flexibility, and ability to create aesthetically pleasing charts with minimal code. In this blog post, we’ll explore how to use Seaborn to create a variety of charts in Jupyter Notebooks,…