Skip to content
Higherpass
  • DevOps
  • Javascript
  • ML-AI
  • Python
Higherpass
  • Home
  • matplotlib

Tag: matplotlib

Matplotlib 3D Visualization
Categories Python Jupyter Notebooks

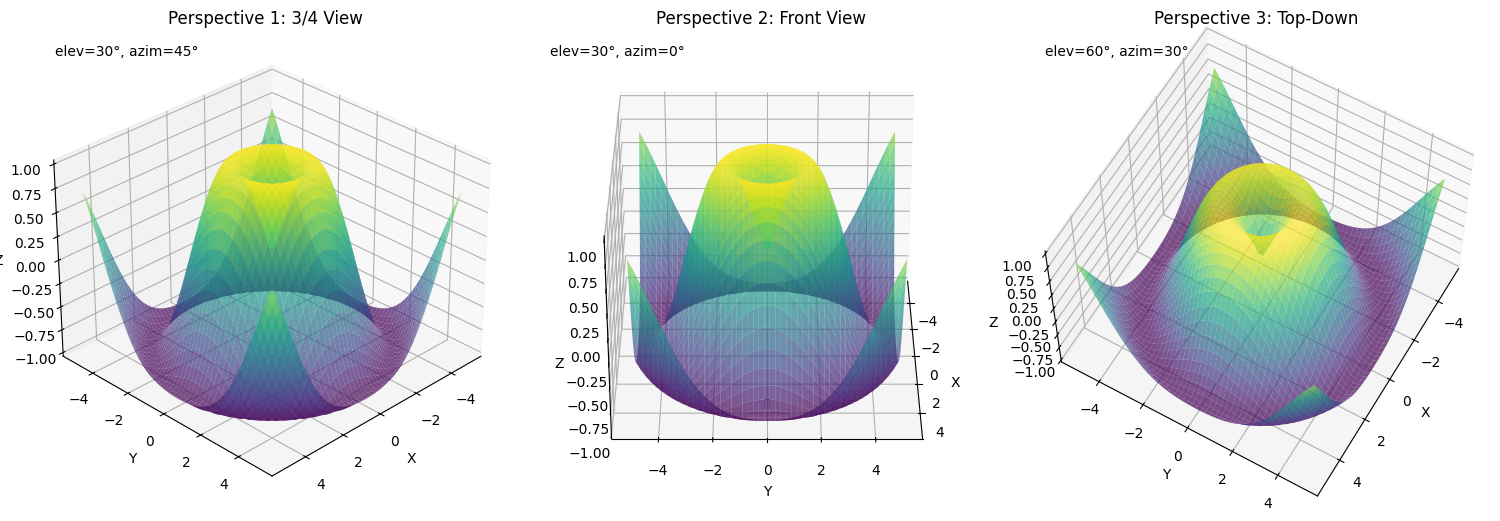
Creating 3D Visualizations with Matplotlib in Python

  • By Craig
  • May 23, 2025

Introduction Data visualization has evolved beyond simple 2D plots, and Matplotlib’s powerful 3D capabilities enable us to create compelling visualizations that bring data to…

Read More
Categories Jupyter Notebooks

Using Ipywidgets in Jupyter Notebooks

  • By Craig
  • April 26, 2025

Introduction to Ipywidgets Ipywidgets are a powerful tool that can enhance the interactivity and functionality of Jupyter Notebooks. These widgets allow users to create…

Read More
Seaborn Multiple Bar Charts
Categories Python Jupyter Notebooks

Creating Charts with Python and Seaborn

  • By Craig
  • March 27, 2025

Data visualization is a crucial part of understanding and communicating insights from data. Among the many Python libraries available for visualization, Seaborn stands out for its…

Read More

Popular Posts

  • Getting Started with Three.js in Vue 3
  • Building Custom Chatbots with Atomic-Agents and OpenAI
  • Building a LangGraph.JS Agent in TypeScript with Memory
  • LangGraph Basics: Building Advanced AI Agents with Graph Architecture
  • Testing LangGraph Agents with pytest and Test-Driven Development
Copyright © 2025
  • DevOps
  • Javascript
  • ML-AI
  • Python