Tag: line chart

  • Creating Charts and Graphs in JavaScript with React and Recharts

    Creating Charts and Graphs in JavaScript with React and Recharts

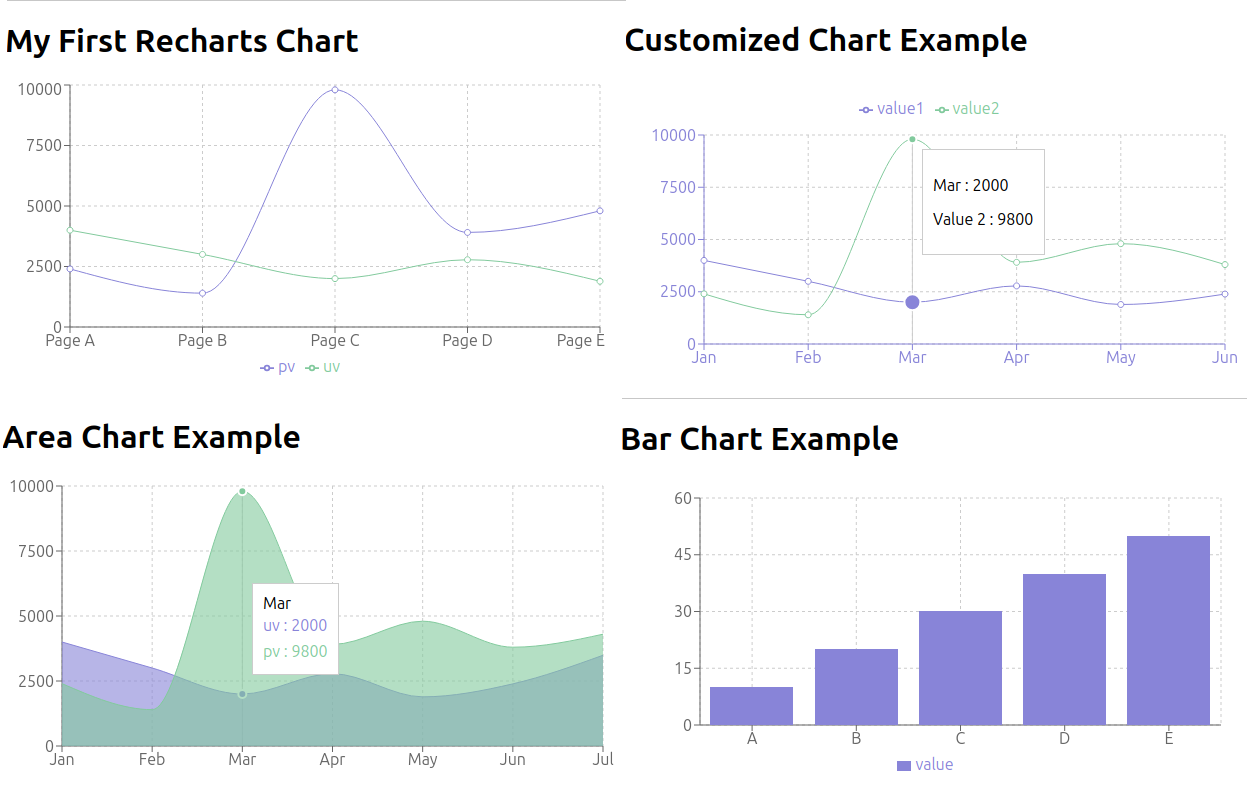
    Introduction In the world of web development, data visualization plays a crucial role in conveying information in a clear and concise manner. Charts and graphs are powerful tools that help users understand complex data sets at a glance. JavaScript, with its versatility and popularity, is often the language of choice for creating interactive and dynamic…

  • Creating Charts with Python and Seaborn

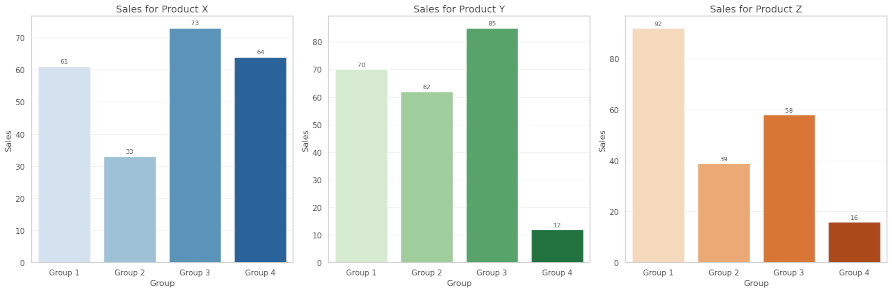
    Data visualization is a crucial part of understanding and communicating insights from data. Among the many Python libraries available for visualization, Seaborn stands out for its simplicity, flexibility, and ability to create aesthetically pleasing charts with minimal code. In this blog post, we’ll explore how to use Seaborn to create a variety of charts in Jupyter Notebooks,…