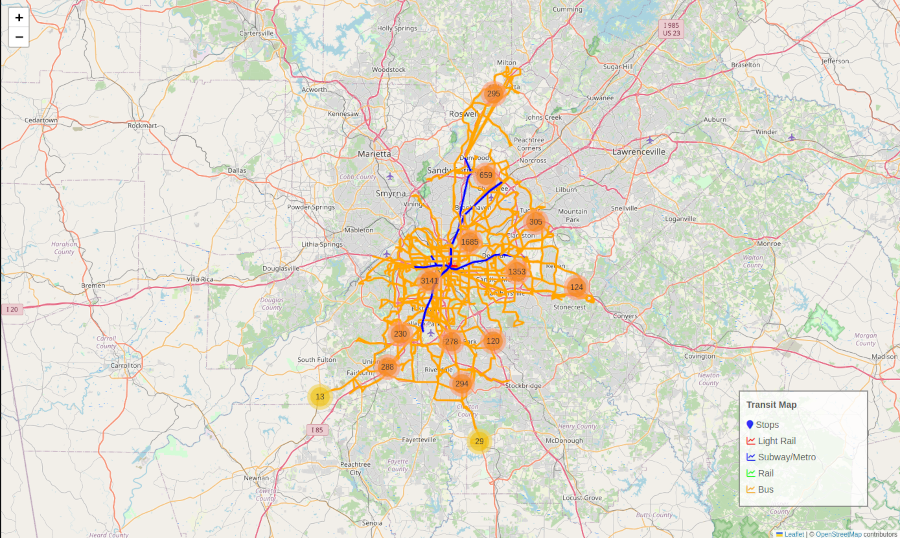
LeafletJS Integration with Vue 3, TypeScript, and Vite
Introduction Interactive maps have become essential components in many web applications today – from location-based…
Introduction Interactive maps have become essential components in many web applications today – from location-based…
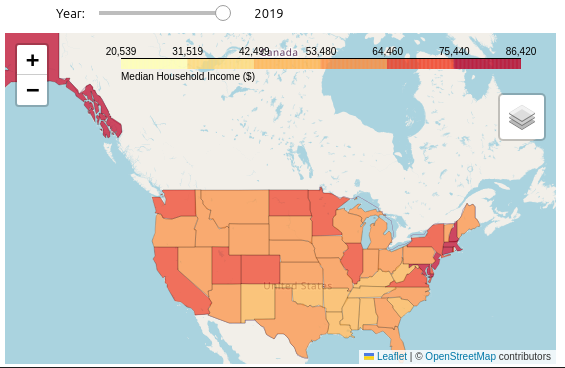
Introduction to Ipywidgets Ipywidgets are a powerful tool that can enhance the interactivity and functionality…
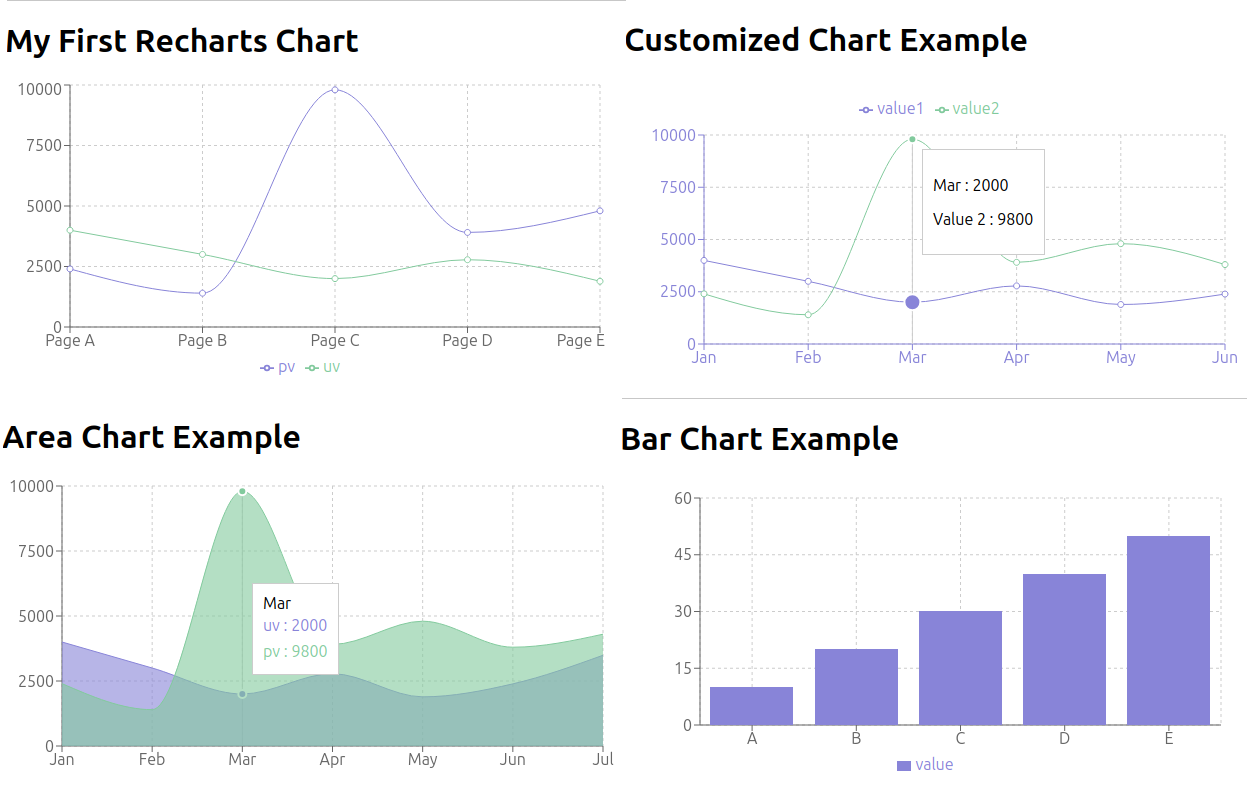
Introduction In the world of web development, data visualization plays a crucial role in conveying…
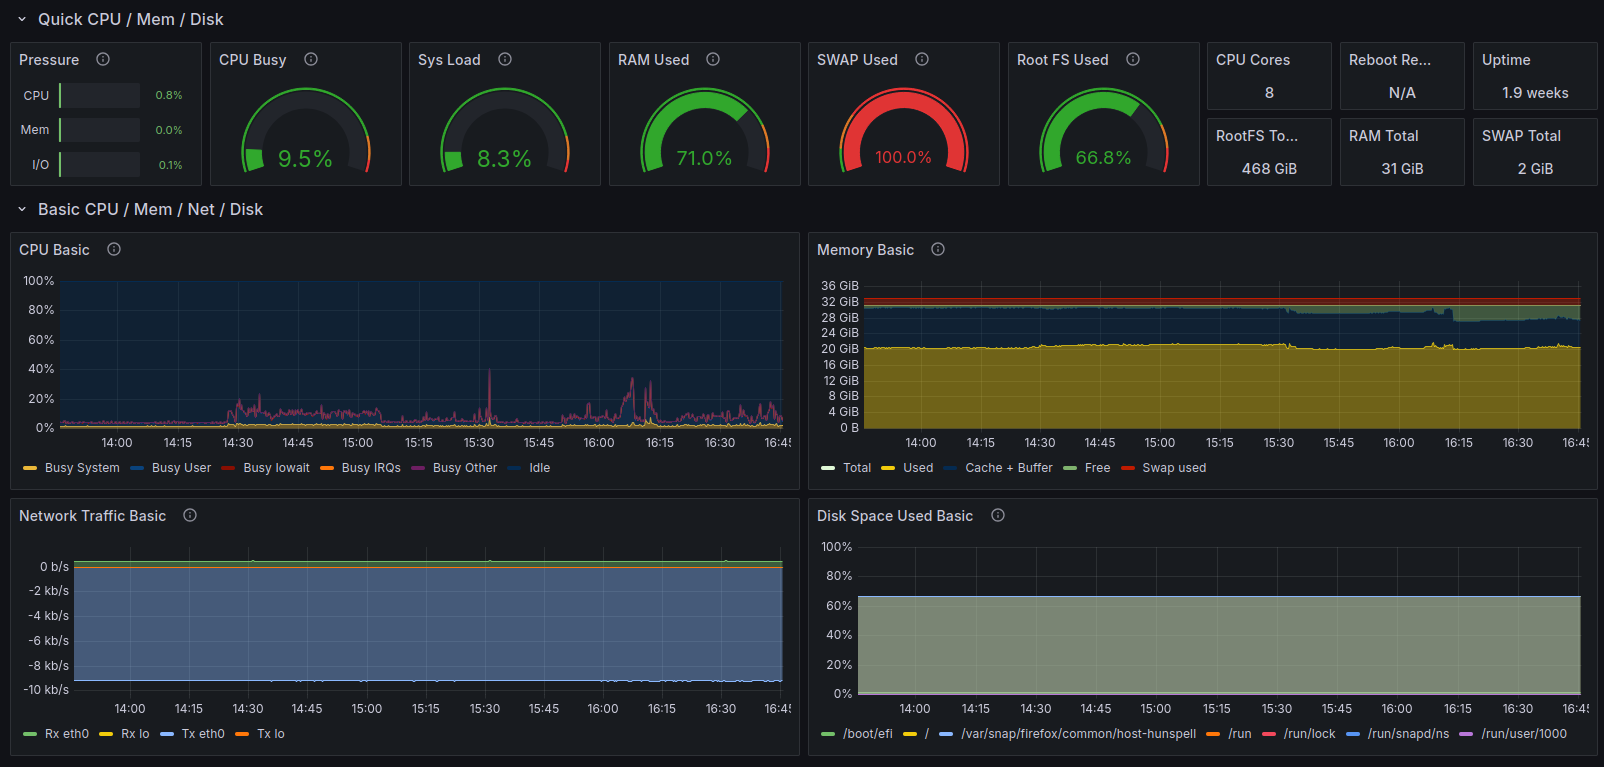
Introduction Monitoring infrastructure and applications is essential for maintaining system health and performance. This guide…
Folium makes it easy to create beautiful interactive web maps in Python by combining the…