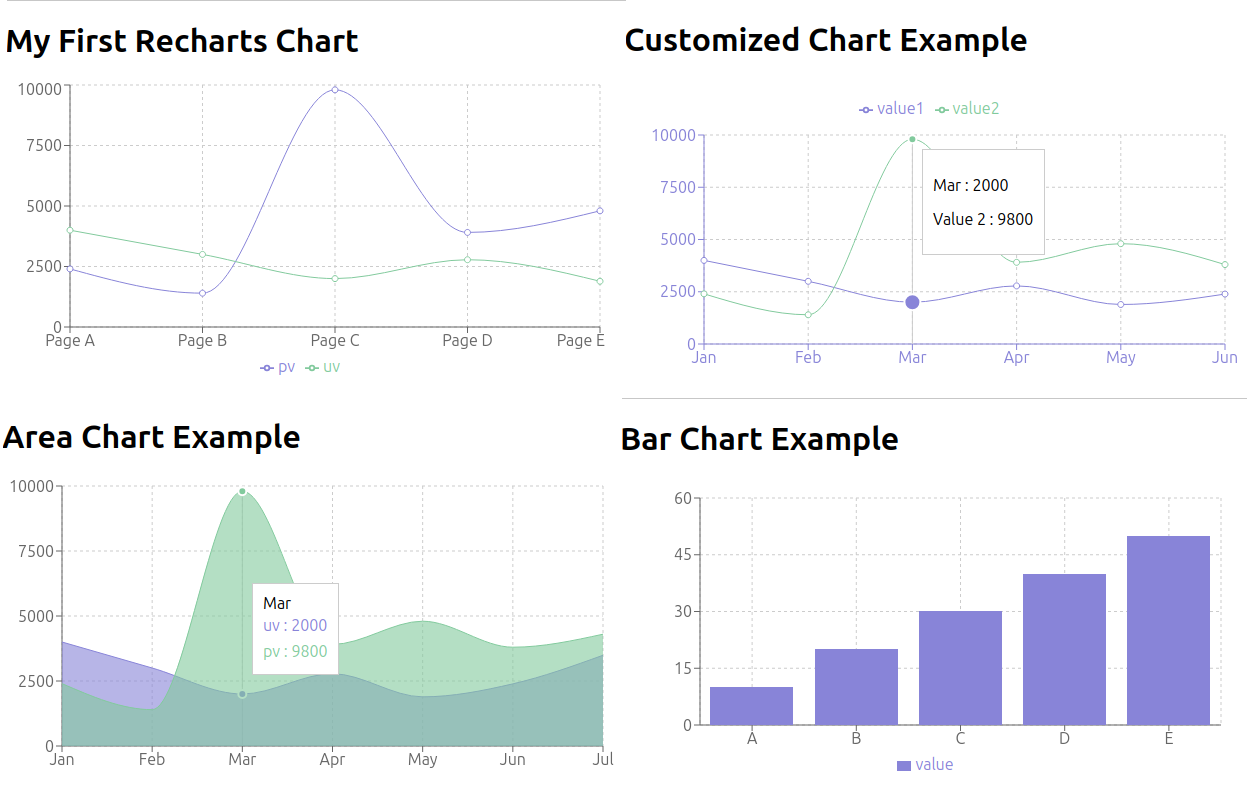
Skip to content

Higherpass

Higherpass

  • DevOps
  • Javascript
  • ML-AI
  • Python

Javascript Visualization and Mapping

Javascript Visualization and Mapping

Featured Visualization Article

Recharts Example Charts

Creating Charts and Graphs in JavaScript with React and Recharts

Newest Posts

  • LeafletJS Integration with Vue 3, TypeScript, and Vite

    LeafletJS Integration with Vue 3, TypeScript, and Vite

  • Creating Charts and Graphs in JavaScript with React and Recharts

    Creating Charts and Graphs in JavaScript with React and Recharts

Popular Posts

  • Building a LangGraph.JS Agent in TypeScript with Memory
  • LangGraph Basics: Building Advanced AI Agents with Graph Architecture
  • Testing LangGraph Agents with pytest and Test-Driven Development
  • Getting Started with Three.js in Vue 3
  • Building Custom Chatbots with Atomic-Agents and OpenAI

Featured Posts

DevOps

Installing Prometheus and Grafana with Docker Compose

Load and Scale Testing Modern Web Applications

Javascript

Using TensorFlow.js ML Models for Pose Detection in the Browser

Enhancing Three.js Scenes with Shadows and Fog

ML-AI

Classifying Technical Documentation with TensorFlow: Building a GitHub README Classifier

Building a MCP Server So LLMs Can Count Letters

Python

Testing LangGraph Agents with pytest and Test-Driven Development

Creating GStreamer Pipelines in Python

Categories

  • DevOps
  • Javascript
  • Javascript Frameworks
  • Javascript Graphics
  • Javascript LLMs and Agents
  • Javascript Machine Learning
  • Javascript Visualization and Mapping
  • ML-AI
  • Python
  • Python Jupyter Notebooks
  • Python LLM Agents
  • Python Machine Learning

(c) 2025 Higherpass.com