Creating 3D Visualizations with Matplotlib in Python
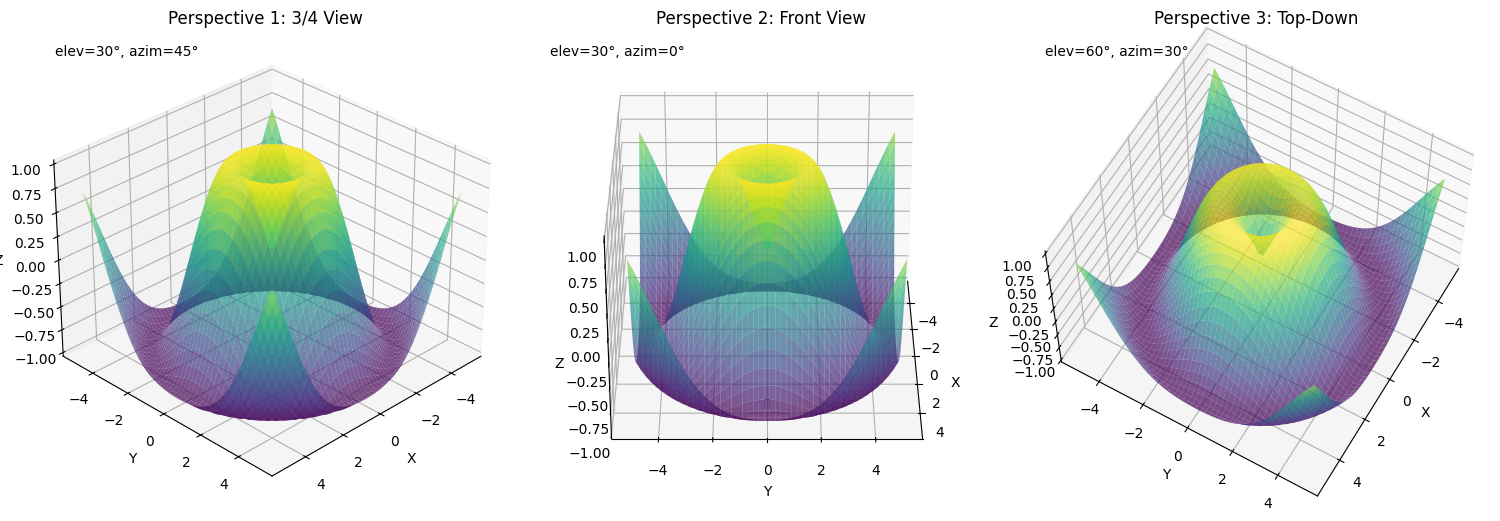
Introduction Data visualization has evolved beyond simple 2D plots, and Matplotlib’s powerful 3D capabilities enable…
Introduction Data visualization has evolved beyond simple 2D plots, and Matplotlib’s powerful 3D capabilities enable…
Introduction to Ipywidgets Ipywidgets are a powerful tool that can enhance the interactivity and functionality…
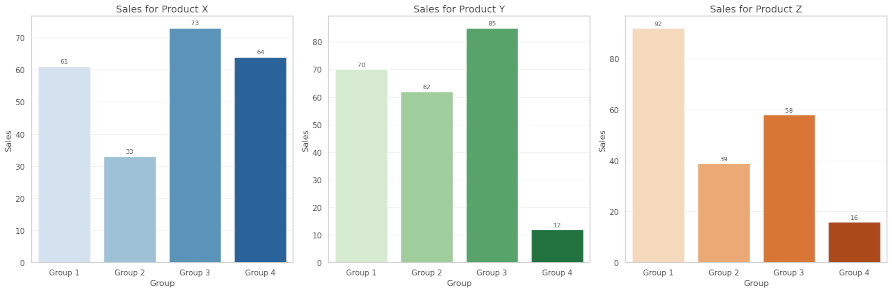
Data visualization is a crucial part of understanding and communicating insights from data. Among the…
In this tutorial, I’ll walk you through how to build a machine learning system that…
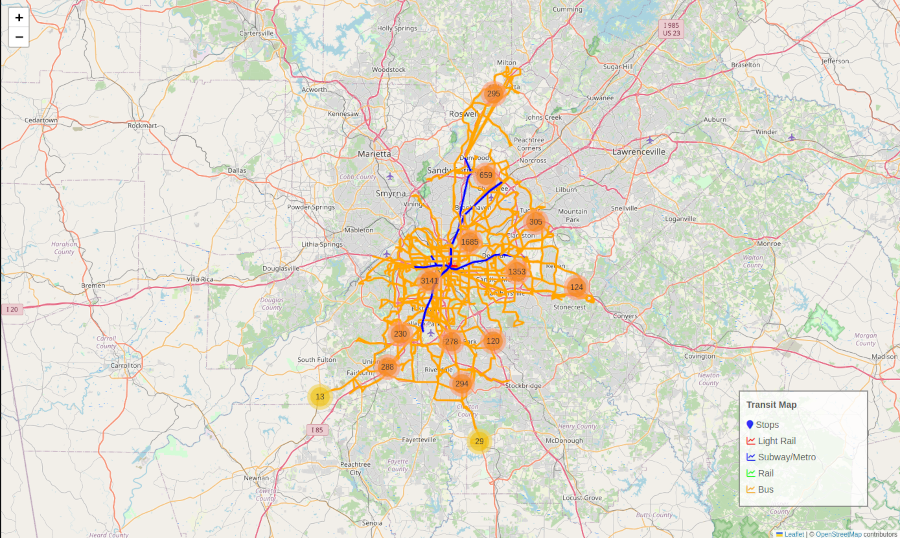
Folium makes it easy to create beautiful interactive web maps in Python by combining the…
Introduction Jupyter notebooks are powerful interactive computing environments that have revolutionized how we work with…