Installing ELK Stack with Docker Compose
The ELK Stack (Elasticsearch, Logstash, and Kibana) has become the go-to solution for centralized logging and analytics in modern applications. This powerful combination of tools allows organizations to collect, process, store, and visualize data in real-time. By implementing ELK Stack with Docker Compose, we can significantly simplify the deployment and management process.
Introduction
What is ELK Stack?
- Elasticsearch: A distributed search and analytics engine
- Logstash: A data processing pipeline for log ingestion
- Kibana: A visualization platform for exploring and analyzing data
Prerequisites and System Requirements
Required software components
- Docker Engine (latest stable version)
- Docker Compose
Minimum hardware specifications
- RAM: 4GB minimum (8GB recommended)
- CPU: 2 cores minimum
- Storage: 20GB free disk space
Port requirements and networking
- Elasticsearch: 9200 (HTTP), 9300 (node communication)
- Kibana: 5601 (web interface)
- Logstash: 5044 (Beats input), 9600 (monitoring API)
Project Setup and File Preparation
Creating the base directory structure
First, create a directory structure to organize your ELK Stack implementation:
mkdir -p elk-stack/{elasticsearch,kibana,logstash}/{config,}
mkdir -p elk-stack/logstash/pipeline
cd elk-stack
This creates the following structure:
elk-stack/
├── docker-compose.yml
├── elasticsearch/
│   └── config/
├── kibana/
│   └── config/
└── logstash/
    ├── config/
    └── pipeline/
Creating configuration files
- Create Elasticsearch configuration (elasticsearch/config/elasticsearch.yml):
cluster.name: "docker-cluster"
network.host: 0.0.0.0
discovery.type: single-node
xpack.security.enabled: false
- Create Kibana configuration (kibana/config/kibana.yml):
server.name: kibana
server.host: "0.0.0.0"
server.port: 5601
elasticsearch.hosts: ["http://elasticsearch:9200"]
elasticsearch.requestTimeout: 90000
- Create Logstash configuration (logstash/config/logstash.yml):
http.host: "0.0.0.0"
xpack.monitoring.elasticsearch.hosts: ["http://elasticsearch:9200"]
- Create a basic Logstash pipeline (logstash/pipeline/logstash.conf):
input {
  beats {
    port => 5044
  }
}

filter {
  grok {
    match => { "message" => "%{COMBINEDAPACHELOG}" }
  }
  date {
    match => [ "timestamp", "dd/MMM/yyyy:HH:mm:ss Z" ]
  }
}

output {
  elasticsearch {
    hosts => ["elasticsearch:9200"]
    index => "logstash-%{+YYYY.MM.dd}"
  }
}
Creating the Docker Compose file
Create the docker-compose.yml file in your project root:
version: '3.8'
services:
  elasticsearch:
    image: elasticsearch:8.18.1
    environment:
      - discovery.type=single-node
      - xpack.security.enabled=false
      - "ES_JAVA_OPTS=-Xms512m -Xmx512m"  # Lower memory for testing
    ports:
      - "9200:9200"
    volumes:
      - elasticsearch-data:/usr/share/elasticsearch/data
      - ./elasticsearch/config/elasticsearch.yml:/usr/share/elasticsearch/config/elasticsearch.yml
    healthcheck:
      test: ["CMD-SHELL", "curl -s http://localhost:9200/_cluster/health | grep -q '\"status\":\"green\"\\|\"status\":\"yellow\"'"]
      interval: 10s
      timeout: 10s
      retries: 20

  kibana:
    image: kibana:8.18.1  # Make sure this version matches Elasticsearch
    ports:
      - "5601:5601"
    volumes:
      - ./kibana/config/kibana.yml:/usr/share/kibana/config/kibana.yml
    environment:
      - ELASTICSEARCH_HOSTS=http://elasticsearch:9200
      - SERVER_NAME=kibana
      - SERVER_HOST=0.0.0.0
    depends_on:
      elasticsearch:
        condition: service_healthy  # This ensures Elasticsearch is ready
    restart: unless-stopped

  logstash:
    image: logstash:8.18.1
    ports:
      - "5044:5044"
      - "9600:9600"
    volumes:
      - ./logstash/config/logstash.yml:/usr/share/logstash/config/logstash.yml
      - ./logstash/pipeline:/usr/share/logstash/pipeline
    depends_on:
      - elasticsearch
    restart: unless-stopped

volumes:
  elasticsearch-data:
Deployment and Verification
Starting the ELK Stack
Deploy the entire stack with a single command:
docker-compose up -d
This command:
- Pulls the necessary Docker images if they aren’t already available
- Creates containers for all three services
- Sets up the required networking between containers
- Starts the services in detached mode (background)
- Mounts the configuration files into the appropriate locations
Verifying the installation
- Check if all containers are running:
docker-compose ps
- Verify Elasticsearch is available:
curl http://localhost:9200
You should receive a JSON response with cluster information.
- Access Kibana in your web browser:
http://localhost:5601
- Check Logstash’s status:
curl http://localhost:9600/?pretty
Understanding Configuration Options
Now that you have a functional ELK Stack, let’s explore the configuration options in greater detail.
Memory and Performance Settings
Elasticsearch JVM settings
ES_JAVA_OPTS: "-Xms2g -Xmx2g"
-Xms2g: Sets the minimum heap size to 2GB-Xmx2g: Sets the maximum heap size to 2GB- Setting these values equal prevents heap resizing, reducing garbage collection pauses
- For production, allocate 50% of available RAM, but not more than 31GB
Index performance settings
index.number_of_shards: 1
index.number_of_replicas: 0
- For development: Use a single shard with no replicas
- For production: Increase shards based on node count and data volume
- Add replicas (typically 1 or more) for data redundancy
Network and Connection Settings
# Elasticsearch settings
network.host: 0.0.0.0
http.port: 9200

# Kibana settings
server.host: "0.0.0.0"
server.port: 5601
elasticsearch.requestTimeout: 90000

# Logstash settings
http.host: "0.0.0.0"
These settings control network accessibility:
0.0.0.0binds to all available interfaces- Port settings define the standard access points
elasticsearch.requestTimeoutincreases connection patience during startup
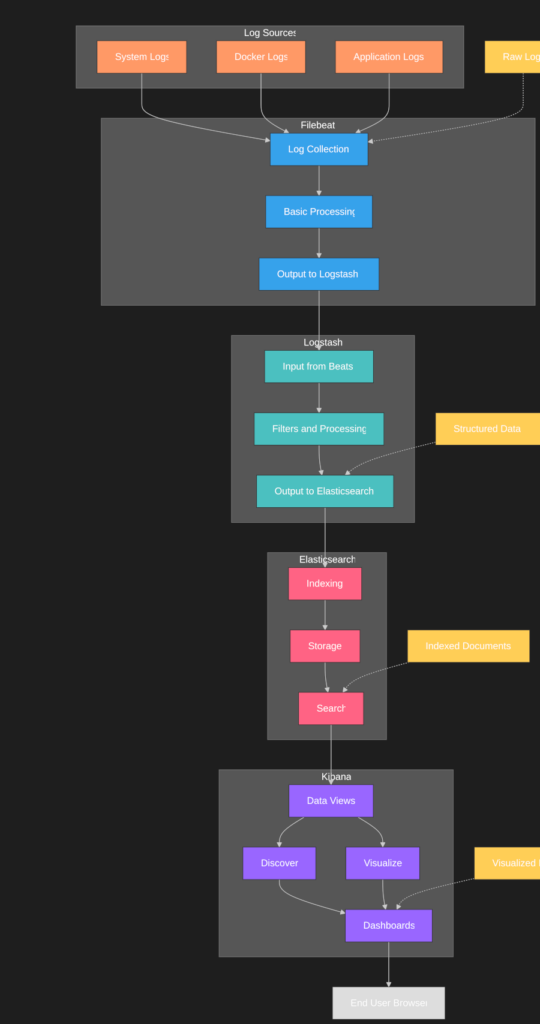
Data Processing Pipeline
The Logstash pipeline configuration defines the complete data flow:
input → filter → output
- Inputs: Define data sources (Beats, files, databases, etc.)
- Filters: Transform and enrich data (parsing, field extraction, calculations)
- Outputs: Send data to destinations (Elasticsearch, files, notifications)
Sending Logs to Logstash
Now that your ELK Stack is running, you need to send logs to Logstash for processing. The most common approach is using Filebeat, a lightweight log shipper from the Elastic Beat family.
Setting up Filebeat
- Create a new directory for Filebeat configuration:
mkdir -p filebeat/config
- Create a basic Filebeat configuration (filebeat/config/filebeat.yml):
filebeat.inputs:
- type: log
  enabled: true
  paths:
    - /var/log/*.log
    - /var/log/syslog
    - /var/log/messages

output.logstash:
  hosts: ["logstash:5044"]

logging.level: info
- Set filebeat.yml permissions
sudo chown root:root filebeat/config/filebeat.yml
sudo chmod 644 filebeat/config/filebeat.yml
- Add Filebeat to your docker-compose.yml:
filebeat:
  image: docker.elastic.co/beats/filebeat:8.18.1
  user: root  # Needed to access host logs
  volumes:
    - ./filebeat/config/filebeat.yml:/usr/share/filebeat/filebeat.yml:ro
    - /var/log:/var/log:ro
    - /var/lib/docker/containers:/var/lib/docker/containers:ro
  depends_on:
    - logstash
  restart: unless-stopped
- Restart your Docker Compose environment to include Filebeat:
docker-compose up -d
Custom log sources
To collect logs from your applications:
- For containerized applications, mount their log directories to Filebeat
- For non-containerized applications, configure Filebeat on the host machine
- For cloud services, use cloud-specific integrations or APIs
Verifying log collection
Check if logs are flowing through the pipeline:
- View Filebeat metrics:
docker-compose exec filebeat filebeat status
- Check Logstash for incoming data:
docker-compose logs logstash | grep "beats"
- Verify data in Elasticsearch:
curl -X GET "localhost:9200/logstash-*/_search?pretty&size=5"
Navigating Kibana Interface
Kibana provides a powerful interface for exploring and visualizing your log data.
Initial setup
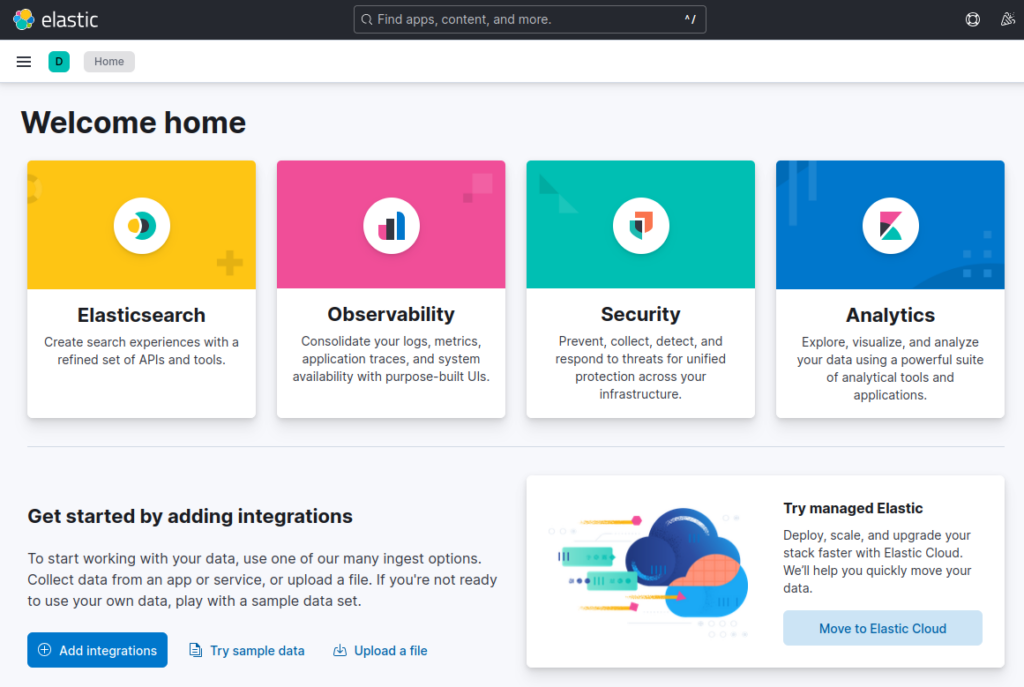
- Open Kibana in your browser: http://localhost:5601
- On first launch, you need to create a data view:
- Click on the hamburger menu (☰) in the upper left corner
- Select “Stack Management” near the bottom
- In the left sidebar under “Kibana”, click “Data Views”
- Click “Create data view”
- Enter a pattern matching your Logstash indices (e.g.,
logstash-*) - Select
@timestampas the primary time field - Click “Save data view to Kibana”
Key interface components
- Discover (Analytics → Discover):
- Explore your raw data
- Create and save searches
- Filter data by field values
- View document details
- Visualize Library (Analytics → Visualize Library):
- Create and manage visualizations
- Access pre-built and custom visualizations
- Build charts, graphs, and other data representations
- Dashboards (Analytics → Dashboards):
- Combine visualizations into comprehensive views
- Create monitoring displays for different use cases
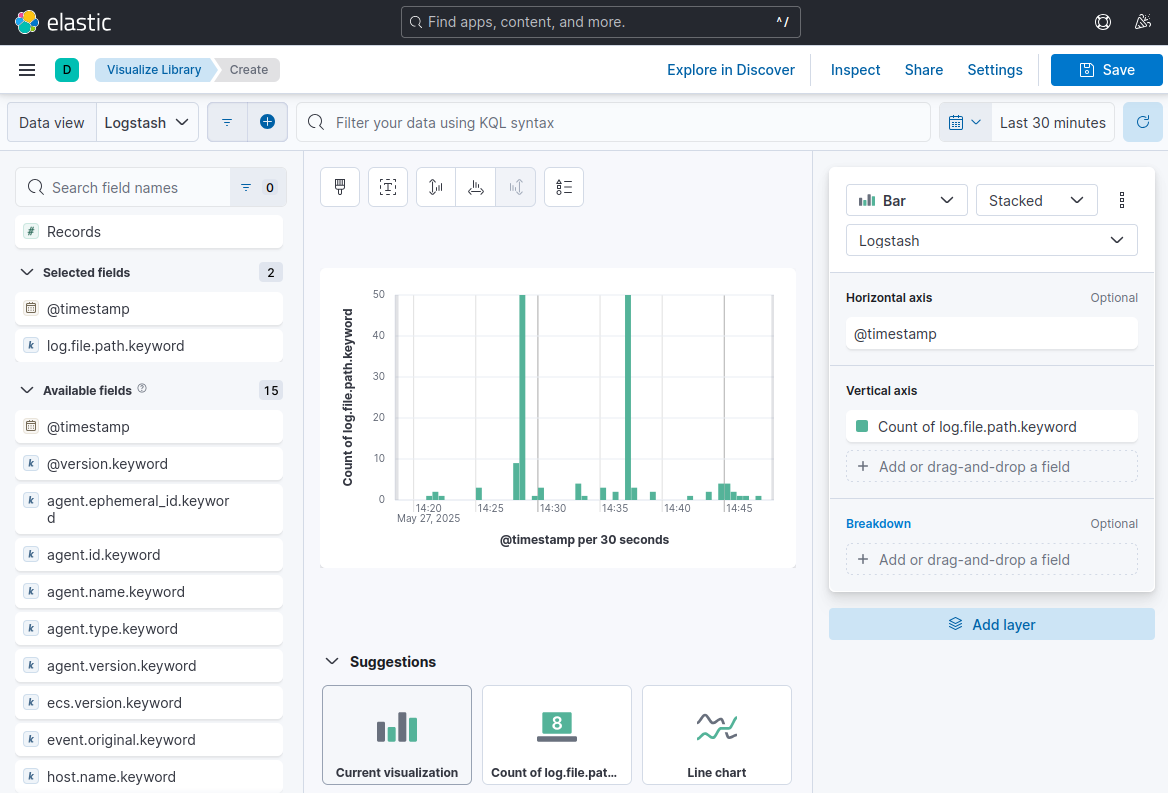
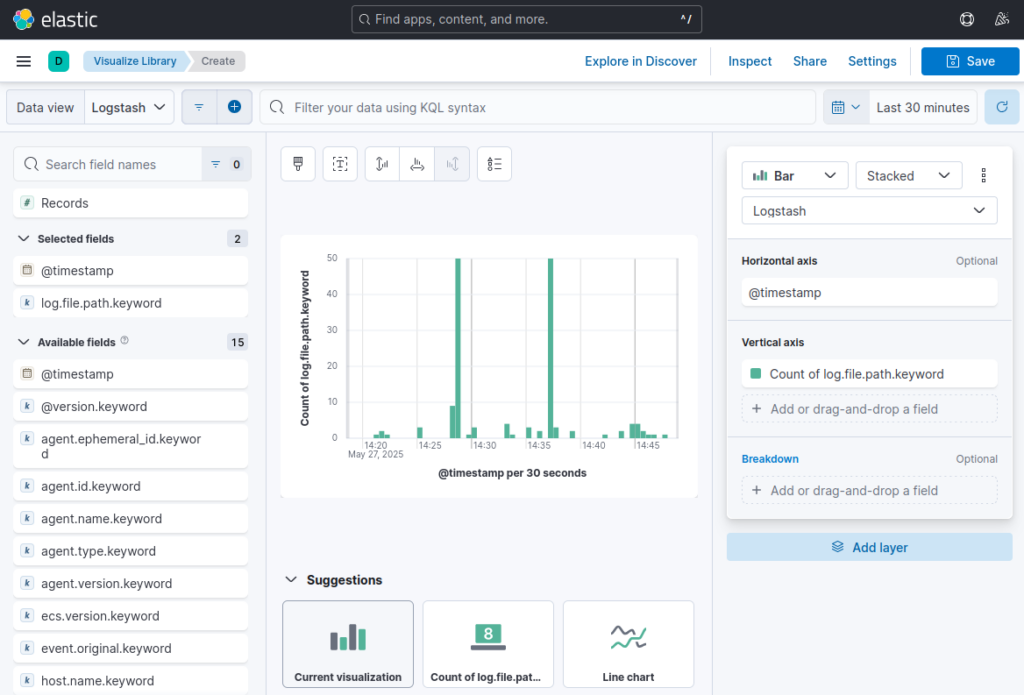
Creating your first visualization
- From the main Kibana page, click on “Analytics” in the left sidebar
- Select “Visualize Library”
- Click “Create new visualization” (blue button)
- Choose a visualization type:
- Lens (recommended for beginners) – drag-and-drop interface
- TSVB – time series visualizations
- Aggregation based – options like bar charts, pie charts, etc.
- Maps – geographical data visualizations
- For a simple Lens visualization:
- Select your data view from the dropdown
- Drag fields from the left panel to the visualization builder:
- Drag a timestamp field to the X-axis
- Drag a numeric field (or count) to the Y-axis
- Drag a categorical field to the “Break down by” section for segmentation
- Use the “Visualization type” selector to switch between chart types
- Adjust aggregation methods (sum, average, count, etc.)
- Configure chart settings using the right panel options
- Click “Save” in the upper right to name and save your visualization
- For aggregation-based visualizations:
- Configure the data panel with:
- Metrics: Count, average, sum, etc.
- Buckets: Date histogram for time-based x-axis, terms for categories
- Use “Split series” with a terms aggregation to segment data by a field
- Adjust the visualization options in the right panel
- Preview your visualization before saving
- Configure the data panel with:
Building a dashboard
- Go to “Analytics” → “Dashboards”
- Click “Create dashboard”
- Click “Add” (or “Add panel” in newer versions)
- Select from:
- Saved visualizations
- New visualizations (creates on the fly)
- Saved searches
- For each visualization added:
- Resize by dragging corners or edges
- Reposition by dragging the panel header
- Access panel options by hovering and clicking the gear icon
- Add filters at the dashboard level to focus on specific data
- Set time range using the time picker in the upper right
- Save your dashboard with a descriptive name
- Optional: Set up auto-refresh for real-time monitoring
Customizing visualizations
For more advanced visualizations:
- Color schemes: Customize colors through the visualization options
- Thresholds: Add warning/error indicators to metrics visualizations
- Annotations: Mark important events on time-series charts
- Drilldowns: Create links between visualizations for deeper analysis
- Markdown: Add text explanations using markdown panels
Conclusion
Summary of key points
- ELK Stack with Docker Compose provides a robust logging solution
- Proper configuration and security measures are essential
- Regular maintenance and monitoring ensure optimal performance
Final recommendations
- Start with a basic setup and gradually add features
- Implement security measures from the beginning
- Regular backups and updates are crucial
- Monitor system resources and performance