Installing Prometheus and Grafana on Kubernetes
Introduction
In today’s cloud-native world, monitoring Kubernetes clusters is crucial for maintaining healthy, performant applications. Prometheus and Grafana form a powerful combination for monitoring Kubernetes environments. Prometheus excels at metrics collection and storage, while Grafana provides rich visualizations and dashboards.
Why monitor Kubernetes clusters
Kubernetes clusters require constant monitoring to:
- Ensure optimal performance
- Detect and troubleshoot issues
- Plan capacity
- Track resource utilization
- Maintain system reliability
Overview of installation methods
You can install Prometheus and Grafana using either kubectl with YAML manifests or Helm charts:
- kubectl: Offers granular control and better understanding of components
- Helm: Provides simplified package management and easy upgrades
Prerequisites
Kubernetes cluster requirements
Version compatibility
- Kubernetes v1.16 or higher
- API server and kubelet metrics enabled
Resource recommendations
- Minimum 2 CPU cores
- At least 4GB RAM
- 50GB storage space
To install a simple Kubernetes cluster check out Installing Minikube and Creating a Kubernetes Cluster.
Required tools
kubectl installation and setup
- Install kubectl following the official documentation
- Configure access to your cluster
- Verify connection
kubectl cluster-info
Helm v3 installation
- Download Helm from the official repository
- Install following platform-specific instructions
- Verify installation
helm version
Setting up the monitoring namespace
Command examples
Create a dedicated namespace for monitoring:
kubectl create namespace monitoring
Verification steps
Confirm namespace creation:
kubectl get namespace monitoring
Installing Prometheus Using kubectl
Creating necessary YAML manifests
ConfigMap configuration
Create prometheus-configmap.yaml with scrape configurations:
apiVersion: v1
kind: ConfigMap
metadata:
  name: prometheus-config
  namespace: monitoring
data:
  prometheus.yml: |
    global:
      scrape_interval: 15s
    scrape_configs:
      - job_name: 'kubernetes-apiservers'
        kubernetes_sd_configs:
          - role: endpoints
Deployment setup
Create prometheus-deployment.yaml:
apiVersion: apps/v1
kind: Deployment
metadata:
  name: prometheus
  namespace: monitoring
spec:
  replicas: 1
  selector:
    matchLabels:
      app: prometheus
  template:
    metadata:
      labels:
        app: prometheus
    spec:
      containers:
      - name: prometheus
        image: prom/prometheus:v2.30.3
Service configuration
Create prometheus-service.yaml:
apiVersion: v1
kind: Service
metadata:
  name: prometheus-service
  namespace: monitoring
spec:
  selector:
    app: prometheus
  ports:
    - port: 9090
      targetPort: 9090
  type: ClusterIP
RBAC settings
Create prometheus-rbac.yaml:
apiVersion: rbac.authorization.k8s.io/v1
kind: ClusterRole
metadata:
  name: prometheus
rules:
- apiGroups: [""]
  resources:
    - nodes
    - nodes/proxy
    - services
    - endpoints
    - pods
  verbs: ["get", "list", "watch"]
Step-by-step deployment process
Application order
Apply the manifests in the following order:
kubectl apply -f prometheus-rbac.yaml
kubectl apply -f prometheus-configmap.yaml
kubectl apply -f prometheus-deployment.yaml
kubectl apply -f prometheus-service.yaml
Verification commands
Check deployment status:
kubectl get pods -n monitoring
kubectl get svc -n monitoring
Common issues and troubleshooting
- Permission problems: Verify RBAC configuration
- Resource constraints: Check pod resource limits
- Connection issues: Ensure service endpoints are correct
Installing Prometheus Using Helm
Adding Prometheus repository
helm repo add prometheus-community https://prometheus-community.github.io/helm-charts
helm repo update
Installation process
Basic installation
helm install prometheus prometheus-community/prometheus \
  --namespace monitoring \
  --create-namespace
Customizing values
Create values.yaml:
server:
  retention: "15d"
  persistentVolume:
    enabled: true
    size: 50Gi
Install with custom values:
helm install prometheus prometheus-community/prometheus \
  -f values.yaml \
  --namespace monitoring
Configuration options
- Storage settings: Configure PV size and storage class
- Retention policies: Set data retention period
- Alert manager setup: Configure alert rules and notifications
Installing Grafana Using kubectl
Required YAML manifests
Deployment configuration
Create grafana-deployment.yaml:
apiVersion: apps/v1
kind: Deployment
metadata:
  name: grafana
  namespace: monitoring
spec:
  replicas: 1
  selector:
    matchLabels:
      app: grafana
  template:
    metadata:
      labels:
        app: grafana
    spec:
      containers:
      - name: grafana
        image: grafana/grafana:8.3.3
Service setup
Create grafana-service.yaml:
apiVersion: v1
kind: Service
metadata:
  name: grafana
  namespace: monitoring
spec:
  selector:
    app: grafana
  ports:
    - port: 3000
      targetPort: 3000
  type: ClusterIP
Deployment walkthrough
Apply configurations:
kubectl apply -f grafana-deployment.yaml
kubectl apply -f grafana-service.yaml
Initial setup
- Access UI via port-forward:
kubectl port-forward svc/grafana 3000:3000 -n monitoring
- Default credentials: admin/admin
- Change password on first login
Installing Grafana Using Helm
Adding Grafana repository
helm repo add grafana https://grafana.github.io/helm-charts
helm repo update
Installation steps
helm install grafana grafana/grafana \
  --namespace monitoring \
  --set persistence.enabled=true \
  --set adminPassword='your-secure-password'
Initial configuration
- Access UI using port-forward
- Configure data sources
- Import dashboards
Integrating Prometheus with Grafana
Adding Prometheus data source
- Navigate to Configuration > Data Sources
- Add Prometheus data source
- URL:
- kubectl: http://prometheus-service:9090
- helm: http://prometheus-server
- Save and test connection
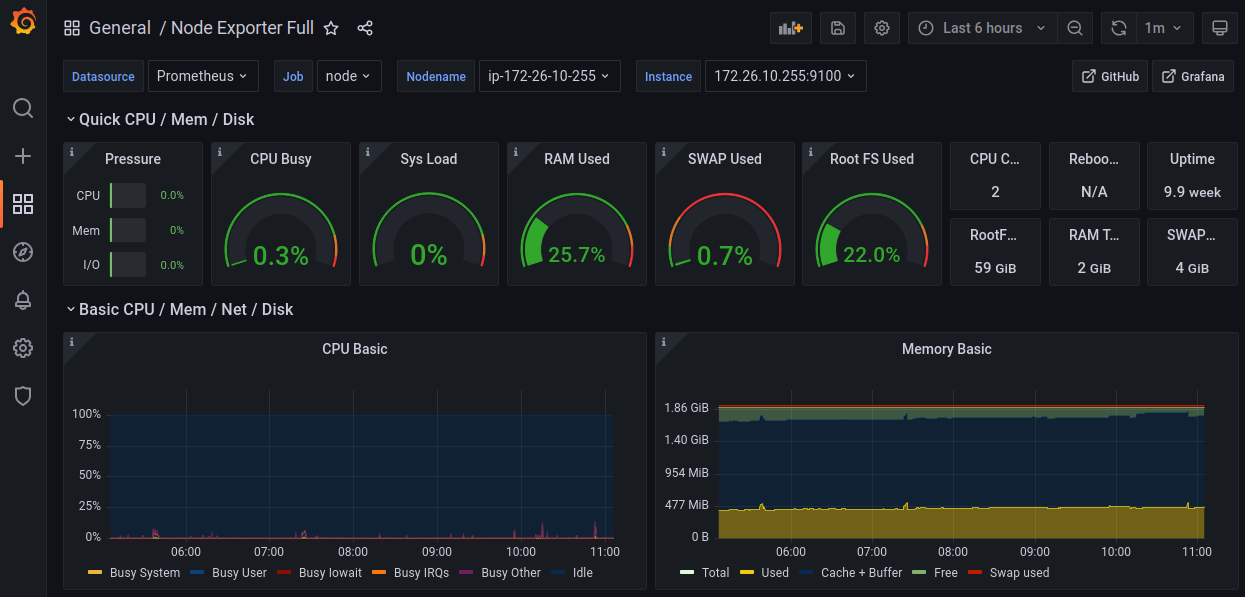
Importing dashboards
- Import recommended dashboards:
- Node Exporter Full (ID: 1860)
- Kubernetes Cluster Monitoring (ID: 315)
- Kubernetes Capacity Planning (ID: 5228)
Basic visualization setup
- Create a new dashboard
- Add panels for key metrics:
- CPU usage
- Memory consumption
- Pod status
- Network traffic
Example PromQL query for CPU usage:
sum(rate(container_cpu_usage_seconds_total{pod!=""}[5m])) by (pod)
Validation and Testing
Health check procedures
kubectl get pods -n monitoring
kubectl describe pod prometheus-server-0 -n monitoring
kubectl logs grafana-deployment-xxxxx -n monitoring
Accessing web interfaces
# Prometheus UI
kubectl port-forward svc/prometheus-server 9090:9090 -n monitoring

# Grafana UI
kubectl port-forward svc/grafana 3000:3000 -n monitoring
Basic Monitoring Setup
Verifying Metrics Collection
After deploying Prometheus, verify that it’s correctly scraping metrics:
# Port-forward to Prometheus
kubectl port-forward svc/prometheus-server 9090:9090 -n monitoring
Then visit http://localhost:9090 in your browser and:
- Go to Status > Targets to verify all endpoints are being scraped
- Check that “kubernetes-apiservers”, “kubernetes-nodes”, and “kubernetes-pods” targets are UP
- In the Graph tab, try querying
upto see which targets are being monitored
Configuring Node Exporter for Hardware Metrics
If not already enabled, deploy node-exporter for hardware-level metrics:
# node-exporter.yaml
apiVersion: apps/v1
kind: DaemonSet
metadata:
  name: node-exporter
  namespace: monitoring
  labels:
    app: node-exporter
spec:
  selector:
    matchLabels:
      app: node-exporter
  template:
    metadata:
      labels:
        app: node-exporter
    spec:
      hostNetwork: true
      hostPID: true
      containers:
      - name: node-exporter
        image: prom/node-exporter:v1.3.1
        args:
        - --path.procfs=/host/proc
        - --path.sysfs=/host/sys
        - --path.rootfs=/host/root
        - --collector.filesystem.ignored-mount-points="^/(dev|proc|sys|var/lib/docker/.+|var/lib/kubelet/.+)($|/)"
        ports:
        - containerPort: 9100
          protocol: TCP
        volumeMounts:
        - name: proc
          mountPath: /host/proc
          readOnly: true
        - name: sys
          mountPath: /host/sys
          readOnly: true
        - name: root
          mountPath: /host/root
          readOnly: true
      volumes:
      - name: proc
        hostPath:
          path: /proc
      - name: sys
        hostPath:
          path: /sys
      - name: root
        hostPath:
          path: /
Apply with:
kubectl apply -f node-exporter.yaml
Setting Up Service Discovery Annotations
For custom applications, add these annotations to your service or pod to enable automatic discovery:
metadata:
  annotations:
    prometheus.io/scrape: "true"
    prometheus.io/port: "8080"  # Replace with your application's metrics port
    prometheus.io/path: "/metrics"  # Optional if using a non-default path
Creating a Basic Dashboard
- Access Grafana via port-forwarding:
kubectl port-forward svc/grafana 3000:3000 -n monitoring - Create a new dashboard with essential panels:
Cluster Overview Panel:# Node countcount(kube_node_info)# Pod countsum(kube_pod_info)# Deployment countcount(kube_deployment_metadata_generation)
Resource Usage Panel:# Cluster CPU Usagesum(rate(container_cpu_usage_seconds_total{container!="POD",container!=""}[5m])) / sum(machine_cpu_cores) * 100# Cluster Memory Usagesum(container_memory_working_set_bytes{container!="POD",container!=""}) / sum(machine_memory_bytes) * 100# Pod CPU Usage Top 5 topk(5,sum(rate(container_cpu_usage_seconds_total{container!="POD",container!=""}[5m])) by (pod))
Health Status Panel:# Unhealthy Podssum(kube_pod_status_phase{phase=~"Failed|Pending|Unknown"})# Container Restartssum(changes(kube_pod_container_status_restarts_total[1h])) by (pod)
Validation and Testing
Health check procedures
kubectl get pods -n monitoring
kubectl describe pod prometheus-server-0 -n monitoring
kubectl logs grafana-deployment-xxxxx -n monitoring
Accessing web interfaces
# Prometheus UI
kubectl port-forward svc/prometheus-service 9090:9090 -n monitoring

# Grafana UI
kubectl port-forward svc/grafana 3000:3000 -n monitoring
Conclusion
Summary of installation methods
Both kubectl and Helm approaches have their merits:
- kubectl offers more control and learning opportunities
- Helm provides easier management and upgrades