DevOps alerting, Alertmanager, cloud-native, containers, dashboards, Data Visualization, DevOps, Docker Compose, Grafana, infrastructure monitoring, metrics, monitoring, observability, performance monitoring, Prometheus, PromQL, service discovery, system metrics, time-series database, Tutorial, visualization Craig 0 Comments
Installing Prometheus and Grafana with Docker Compose: A Comprehensive Guide
Introduction
Monitoring infrastructure and applications is essential for maintaining system health and performance. This guide walks you through setting up a powerful monitoring stack using Docker Compose that combines:
- Prometheus: An open-source monitoring and alerting system that collects and stores time-series metrics data with a powerful query language. Prometheus excels at monitoring containerized environments, microservices, and dynamic infrastructure through its pull-based architecture.
- Grafana: A feature-rich visualization platform that transforms metrics into insightful dashboards with beautiful graphs, charts, and alerts. Grafana connects to various data sources, with Prometheus being one of the most popular.
Together, these tools create a robust monitoring solution that’s easy to deploy and maintain. Prometheus handles the collection and storage of metrics, while Grafana provides the visualization layer that makes those metrics actionable and understandable.
This guide will help you set up a complete monitoring stack capable of tracking system resources, container performance, and application metrics in a containerized environment.
Prerequisites
Before beginning, ensure you have:
- Docker Engine installed and running
- Docker Compose installed
- Minimum 2GB RAM recommended
- Ports 9090, 3000, 9100, and 8080 available
Project Structure
First, create the following directory structure:
monitoring/
├── docker-compose.yml
└── prometheus/
    └── prometheus.yml
Basic Configuration
Create a docker-compose.yml file with the following basic configuration:
version: '3.8'

services:
  prometheus:
    image: prom/prometheus:latest
    container_name: prometheus
    volumes:
      - ./prometheus:/etc/prometheus
      - prometheus_data:/prometheus
    command:
      - '--config.file=/etc/prometheus/prometheus.yml'
      - '--storage.tsdb.path=/prometheus'
    ports:
      - "9090:9090"
    restart: unless-stopped

  grafana:
    image: grafana/grafana:latest
    container_name: grafana
    volumes:
      - grafana_data:/var/lib/grafana
    ports:
      - "3000:3000"
    restart: unless-stopped
    depends_on:
      - prometheus

volumes:
  prometheus_data:
  grafana_data:
This Docker Compose configuration creates:
- Prometheus container: Runs the official Prometheus image with configuration files mounted from your local directory. The
prometheus_datavolume ensures metrics data persists between container restarts. Prometheus listens on port 9090 and automatically restarts if it crashes. - Grafana container: Deploys the official Grafana image with a persistent volume for storing dashboards, users, and other settings. It exposes port 3000 for web access and depends on the Prometheus container to ensure it starts only after Prometheus is running.
- Persistent volumes: Two named volumes (
prometheus_dataandgrafana_data) ensure your monitoring data and configurations survive container restarts or rebuilds.
Adding Exporters
Enhance your monitoring capabilities by adding essential exporters:
  node-exporter:
    image: prom/node-exporter:latest
    container_name: node-exporter
    ports:
      - "9100:9100"
    volumes:
      - /proc:/host/proc:ro
      - /sys:/host/sys:ro
      - /:/rootfs:ro
    command:
      - '--path.procfs=/host/proc'
      - '--path.rootfs=/rootfs'
      - '--path.sysfs=/host/sys'
      - '--collector.filesystem.mount-points-exclude=^/(sys|proc|dev|host|etc)($$|/)'
    restart: unless-stopped

  cadvisor:
    image: gcr.io/cadvisor/cadvisor:latest
    container_name: cadvisor
    volumes:
      - /:/rootfs:ro
      - /var/run:/var/run:ro
      - /sys:/sys:ro
      - /var/lib/docker/:/var/lib/docker:ro
    ports:
      - "8080:8080"
    restart: unless-stopped
This configuration adds two important exporters to your monitoring stack:
- Node Exporter: Collects and exposes system metrics from the host machine including CPU usage, memory, disk space, and network statistics. It mounts host system directories as read-only volumes to access hardware and OS metrics. The command parameters specify paths to host filesystems and exclude unnecessary mount points.
- cAdvisor (Container Advisor): Provides container-specific metrics about resource usage and performance. It requires access to Docker’s data directory and system information to gather container statistics. cAdvisor exposes a web interface and API on port 8080 that both humans and Prometheus can use to view container metrics.
Both exporters are configured to restart automatically if they crash, ensuring continuous monitoring of your system and containers.
Adding Alert Manager
Extend your setup with alerting capabilities:
  alertmanager:
    image: prom/alertmanager:latest
    container_name: alertmanager
    ports:
      - "9093:9093"
    volumes:
      - ./alertmanager:/etc/alertmanager
    command:
      - '--config.file=/etc/alertmanager/alertmanager.yml'
This configuration adds:
- Alert Manager: Handles alerts sent by Prometheus and routes them to the appropriate receiver channels like email, Slack, or PagerDuty. It deduplicates, groups, and routes alerts based on rules defined in its configuration file. The container mounts a local directory containing alerting rules and listens on port 9093 for incoming alerts and web UI access.
Additional Exporters
Consider adding these exporters based on your infrastructure:
  mysql-exporter:
    image: prom/mysqld-exporter:latest
    ports:
      - "9104:9104"

  redis-exporter:
    image: oliver006/redis_exporter:latest
    ports:
      - "9121:9121"
These specialized exporters extend your monitoring capabilities:
- MySQL Exporter: Collects performance and health metrics from MySQL database servers. It exposes metrics like connection counts, query execution time, buffer usage, and more on port 9104. This requires appropriate database credentials to be provided via environment variables (not shown).
- Redis Exporter: Monitors Redis instances by gathering metrics about memory usage, connections, persistence, replication lag, and command statistics. It makes these metrics available on port 9121 for Prometheus to scrape. Like the MySQL exporter, connection details would need to be configured via environment variables.
Adding these exporters allows you to monitor database performance alongside your system and container metrics, giving you comprehensive visibility across your entire stack.
Configuring Prometheus
Create prometheus/prometheus.yml with the following configuration:
global:
  scrape_interval: 15s
  evaluation_interval: 15s

scrape_configs:
  - job_name: 'prometheus'
    static_configs:
      - targets: ['localhost:9090']

  - job_name: 'node-exporter'
    static_configs:
      - targets: ['node-exporter:9100']

  - job_name: 'cadvisor'
    static_configs:
      - targets: ['cadvisor:8080']
Launching the Stack
- Navigate to your project directory:
cd monitoring - Start the services:
docker-compose up -d - Verify all containers are running:
docker-compose ps
Configuring Grafana
- Access Grafana at
http://localhost:3000 - Log in with default credentials:
- Username: admin
- Password: admin
- Change the password when prompted
- Add Prometheus data source:
- Click “Connections” → “Data Sources” → Click “Add Data source”
- Select “Prometheus”
- Set URL to
http://prometheus:9090 - Click “Save & Test”
Creating Your First Dashboard
After connecting Prometheus as a data source, you can create your first monitoring dashboard:
- Create a new dashboard:
- Click on the “+” icon in the top navigation
- Select “New Dashboard”
- Click “Add visualization”
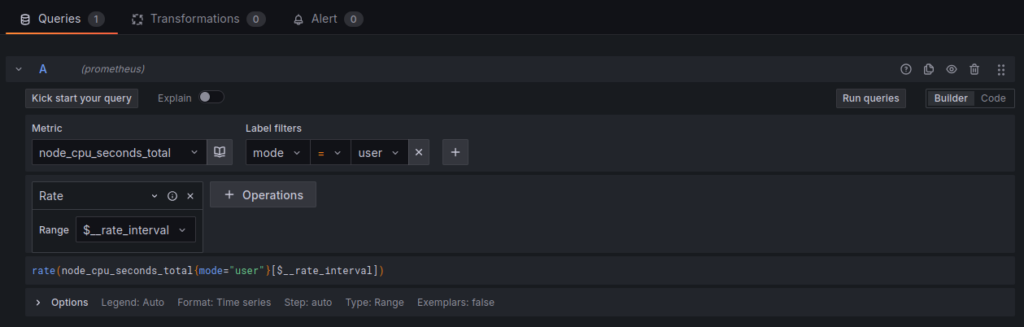
- Configure your first panel:
- Select “Prometheus” as the data source
- In the query builder, enter a basic metric like
node_cpu_seconds_total - Add a filter:
mode="user" - Apply the
ratefunction:rate(node_cpu_seconds_total{mode="user"}[1m]) - Click “Run queries” to preview
- Customize the visualization:
- Change the panel title to “CPU Usage”
- Select an appropriate visualization type (try “Time series”)
- Under the “Standard options” tab, set the unit to “Misc” → “Percent (0.1-1.0)”
- Adjust the min/max range if needed
- Add a description for clarity
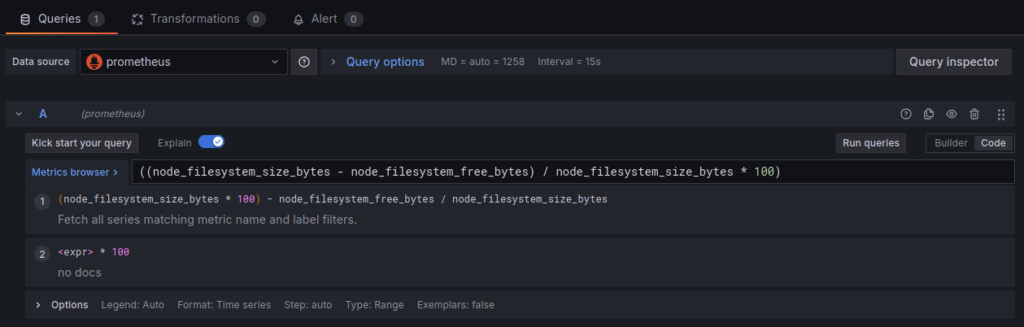
- Add more panels:
- Return to dashboard view by clicking “Apply”
- Click “Add” → “visualization” again
- In the query editor click over to “Code” from “Builder”
- Add this in for the query
((node_filesystem_size_bytes - node_filesystem_free_bytes) / node_filesystem_size_bytes * 100)
- Organize your dashboard:
- Drag panels to rearrange them
- Resize panels by dragging corners
- Add a “Text” panel with instructions or context
- Create rows to group related panels
- Add dashboard variables for dynamic filtering:
- Click the gear icon to open dashboard settings
- Select “Variables” and “Add variable”
- Create a variable named “instance” that queries
label_values(node_exporter_build_info, instance) - Use this variable in your queries:
node_cpu_seconds_total{instance="$instance"}
- Save your dashboard:
- Click the save icon in the top right
- Give your dashboard a descriptive name
- Add relevant tags for easier searching
- Click “Save”
This simple dashboard gives you immediate visibility into key system metrics. As you become more comfortable with Grafana, you can create more complex dashboards with additional panels, alerts, and annotations.
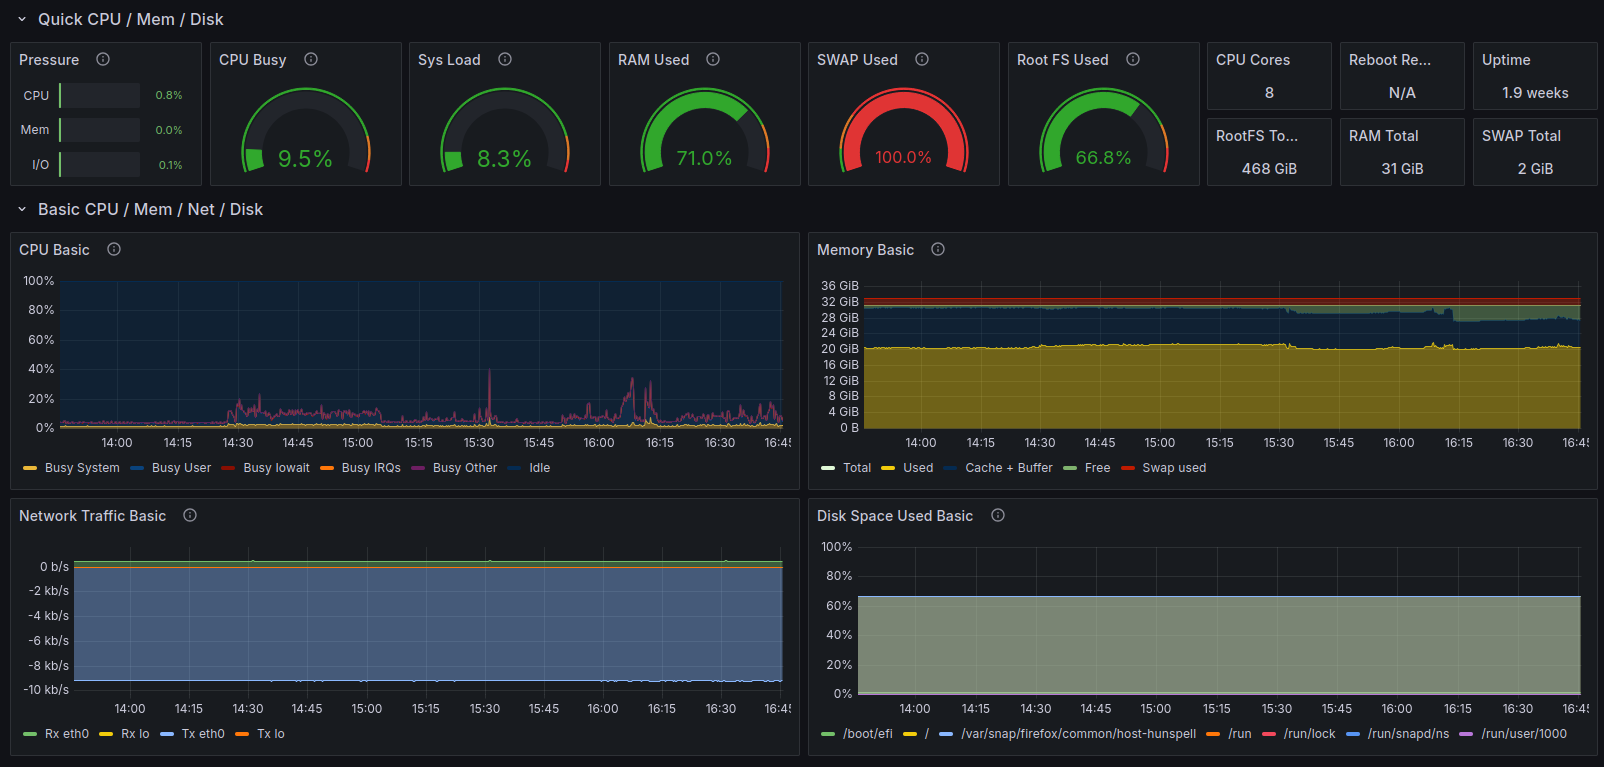
For more advanced monitoring, explore Grafana’s pre-built dashboards by clicking “Import” from the dashboard menu and entering these popular dashboard IDs:
- Node Exporter Full (ID: 1860)
- Docker and System Monitoring (ID: 893)
- Prometheus 2.0 Overview (ID: 3662)
- Container Monitoring (ID: 14282)
Best Practices
Security
- Change default credentials immediately: Default credentials are widely known and the first target for attackers. Update the default admin password for Grafana during initial login and configure application-level authentication for Prometheus using a reverse proxy like Nginx with basic auth.
- Implement authentication for exposed services: Configure authentication for all externally accessible endpoints. For Prometheus, use a reverse proxy with basic authentication or OAuth2. For Grafana, set up LDAP/Active Directory integration or OAuth providers for enterprise environments.
- Use network isolation through Docker networks: Create dedicated Docker networks for your monitoring stack to control container-to-container communication. Only expose the ports that need to be publicly accessible:
networks:
 monitoring:
 driver: bridge

services: prometheus:
 networks:
- monitoring # Only expose ports to other services in the monitoring network - Regularly update container images: Schedule routine updates to patch security vulnerabilities. Use specific version tags instead of ‘latest’ for production deployments to control when upgrades occur:
# Update images and restart containersdocker-compose pull docker-compose up -d
Performance
- Adjust scrape intervals based on your needs: Default 15-second scrape intervals may be too frequent for some metrics and not frequent enough for others. Tune these based on metric volatility and importance:
networks:
 monitoring:
 driver: bridge
services:
 prometheus:
 networks:
- monitoring - # Only expose ports to other services in the monitoring network
- Monitor resource usage of the stack: The monitoring system itself needs monitoring. Set resource limits in your Docker Compose file to prevent containers from consuming excessive resources:
services:
 prometheus:
 deploy:
 resources:
 limits: cpus: '0.50'
memory: 1G - Set appropriate retention periods for metrics: Balance storage requirements with data retention needs. Configure Prometheus’s retention settings:
command:
 - '--config.file=/etc/prometheus/prometheus.yml'
 - '--storage.tsdb.path=/prometheus'
- '--storage.tsdb.retention.time=15d' - Use recording rules for complex queries: Pre-compute expensive queries at scrape time to improve dashboard performance:
# In prometheus.yml
rule_files:
 - /etc/prometheus/rules/*.yml

# In rules/system_metrics.yml
groups:
 - name: system
rules:
 - record: node:memory_utilization:percent
 expr: 100 - ((node_memory_MemFree_bytes + node_memory_Cached_bytes + node_memory_Buffers_bytes) / node_memory_MemTotal_bytes * 100)
Key Takeaways of Prometheus and Grafana
When implementing a Prometheus and Grafana monitoring stack, keep these key takeaways in mind:
Prometheus Strengths
- Pull-Based Architecture: Prometheus actively scrapes metrics from targets on a configurable interval, making it resilient to network issues and providing control over monitoring load.
- Powerful Query Language (PromQL): Allows for complex data analysis and aggregation with a purpose-built query language designed specifically for time-series data.
- Service Discovery: Automatically discovers targets to monitor in dynamic environments like Kubernetes, AWS, or Docker Swarm, reducing manual configuration.
- Built-in Alerting: Native alert definition and generation capability, with AlertManager handling notification routing, grouping, and deduplication.
- Dimensional Data Model: Uses key-value pairs (labels) that enable powerful filtering and grouping of metrics across various dimensions of your infrastructure.
Grafana Advantages
- Visualization Flexibility: Offers numerous visualization options beyond simple graphs, including heatmaps, histograms, tables, and gauges to represent data meaningfully.
- Multi-Source Dashboards: Supports multiple data sources in a single dashboard, allowing you to correlate metrics from various systems in one view.
- User Management: Provides comprehensive user access controls with roles, teams, and permissions for enterprise deployments.
- Alert Management: Offers a unified alerting system that works across all data sources, not just Prometheus.
- Annotation Support: Enables marking significant events (like deployments, incidents, or maintenance) on your monitoring graphs for better context.
Use Cases and Applications
- Infrastructure Monitoring: Track server health, resource utilization, network traffic, and storage capacity.
- Container Orchestration: Monitor Docker containers and Kubernetes clusters with detailed performance metrics.
- Application Performance: Observe response times, error rates, and throughput of your applications.
- Database Monitoring: Track query performance, connection counts, and resource utilization across database systems.
- Business Metrics: Beyond technical metrics, you can monitor business KPIs when your applications expose relevant data points.
Scaling Considerations
- Federation: For large-scale deployments, implement Prometheus federation to have multiple Prometheus instances with hierarchical scraping.
- Remote Storage: Use remote storage integrations for long-term metric retention and to offload storage requirements from Prometheus.
- Load Balancing: For high-availability, deploy multiple scrapers behind a load balancer and use service discovery for automatic configuration.
- Resource Planning: As metrics volume grows, plan for increased CPU, memory, and storage resources, especially for Prometheus instances handling high cardinality metrics.
This Prometheus and Grafana stack provides a solid foundation for comprehensive monitoring of your infrastructure and applications. The Docker Compose setup makes it easy to deploy, while the configuration options allow you to customize the stack to your specific monitoring needs. As your infrastructure grows, you can expand this monitoring solution with additional exporters, custom metrics, and more sophisticated alerting rules.