Programming DevOps baseline metrics, benchmarking, capacity planning, concurrent users, distributed testing, error rates, JMeter, latency, load testing, Locust, monitoring, performance bottlenecks, performance metrics, performance testing, progressive load testing, Python, reporting, resource utilization, response time, scalability, scale testing, stress testing, test automation, throughput, Tutorial, user simulation, visualization, web applications Craig 0 Comments
Load and Scale Testing Modern Web Applications – A Practical Guide
Introduction
In today’s digital landscape, web applications must perform flawlessly under varying loads. Users expect instant responses and seamless experiences, regardless of traffic volume. Businesses face significant consequences when applications fail to meet these performance expectations.
Purpose and Scope
This guide aims to provide developers and QA engineers with practical knowledge about implementing load and scale testing using open-source tools. We’ll focus on hands-on examples and real-world scenarios that help teams:
- Identify performance bottlenecks before they impact users
- Establish reliable metrics for capacity planning
- Build confidence in system reliability under various load conditions
- Create automated testing pipelines that catch performance regressions early
Modern web applications face unprecedented challenges: microservices architectures, cloud deployments, and rapidly fluctuating user demands require robust testing strategies to ensure reliability and performance.
Understanding Load and Scale Testing
Load Testing Definition and Purpose
Load testing evaluates system performance under expected normal and peak load conditions, helping teams understand how their applications behave under real-world conditions. This testing approach:
- Validates the system can handle the expected number of concurrent users
- Confirms response times remain within acceptable thresholds during normal and peak usage
- Identifies performance bottlenecks in the application architecture
- Helps determine if current infrastructure meets business requirements
Scale Testing Definition and Purpose
Scale testing determines an application’s ability to handle increasing or decreasing demands, crucial for modern cloud-based applications with elastic resources. Effective scale testing:
- Verifies system behavior during planned scaling events
- Tests auto-scaling configurations and policies
- Measures resource utilization efficiency during scaling operations
- Identifies potential scaling limits before they affect production
Distinction Between Different Testing Types
Several complementary testing approaches work alongside load and scale testing:
- Load testing focuses on expected conditions, simulating normal and peak traffic patterns.
- Stress testing pushes beyond normal capacity to identify breaking points and failure modes.
- Spike testing examines system response to sudden, extreme load increases.
- Endurance testing verifies system stability over extended periods of continuous operation.
- Volume testing assesses system performance when processing large amounts of data.
Each type serves specific testing objectives and provides unique insights into application performance characteristics.
Key Performance Metrics
When conducting load and scale testing, several key metrics provide essential insights into system performance:
Response Time and Latency
Response time measures the total time from request to response, while latency focuses on network transmission time. These metrics:
- Directly impact user experience and satisfaction
- Help identify slow components in the application stack
- Reveal potential optimization opportunities
- Should be measured at various percentiles (median, 90th, 95th, 99th) to capture edge cases
Throughput (Requests per Second)
Throughput indicates system capacity by measuring successful requests handled per second. This metric:
- Establishes baseline capacity for current infrastructure
- Provides data for capacity planning and scaling decisions
- Helps identify system saturation points
- Should be correlated with other resource metrics to understand limitations
Error Rates and System Stability
Monitoring error rates helps identify system breaking points and stability issues under load. Important aspects include:
- HTTP status code distribution (200s vs. 400s/500s)
- Application-specific errors and exceptions
- Connection timeouts and dropped requests
- Error clustering patterns that might indicate cascading failures
Resource Utilization Metrics
CPU, memory, network, and disk usage patterns reveal system resource constraints. These metrics:
- Help pinpoint specific bottlenecks in the technology stack
- Inform hardware provisioning and scaling decisions
- Identify inefficient code or configurations
- Allow correlation between user load and resource consumption
Concurrent User Handling
Understanding how many simultaneous users the system can handle effectively is crucial for capacity planning. This involves:
- Determining maximum concurrent sessions without performance degradation
- Measuring session handling efficiency across the technology stack
- Identifying session management bottlenecks
- Testing user authentication and authorization systems under load
Open Source Testing Tools – Practical Implementation
Apache JMeter

Setup and configuration
JMeter installation requires Java Runtime Environment (JRE) version 8 or higher. Follow these steps to get started:
- Download the latest JMeter binary from the Apache JMeter website
- Extract the archive to your preferred location
- Navigate to the
bindirectory - Run JMeter:
- On Windows: Double-click
jmeter.bator run it from the command line - On macOS/Linux: Execute
./jmeter.sh
- On Windows: Double-click
For headless execution in CI/CD pipelines, use the non-GUI mode:
./jmeter.sh -n -t your_test_plan.jmx -l results.jtl
Creating test plans
JMeter uses a tree structure for test plans, allowing you to define thread groups, samplers, and listeners. A typical test plan includes:
- Thread Groups: Define the number of users, ramp-up period, and test duration
- HTTP Samplers: Configure requests to your application endpoints
- Listeners: Collect and visualize test results
- Configuration Elements: Set up default request parameters, cookies, and headers
- Assertions: Validate responses to ensure application correctness
To create a basic test plan:
- Right-click on “Test Plan” → Add → Threads → Thread Group
- Configure thread count and ramp-up period
- Right-click on Thread Group → Add → Sampler → HTTP Request
- Configure the request details (URL, method, parameters)
- Right-click on Thread Group → Add → Listener → View Results Tree
Code example: Basic load test script
<?xml version="1.0" encoding="UTF-8"?>
<jmeterTestPlan version="1.2">
  <hashTree>
    <!-- Main Test Plan container that holds all test elements -->
    <TestPlan guiclass="TestPlanGui" testclass="TestPlan" testname="Web App Load Test">
      <!-- Thread Group represents a group of users executing the same scenario -->
      <ThreadGroup guiclass="ThreadGroupGui" testclass="ThreadGroup" testname="Users">
        <!-- Simulate 100 concurrent users -->
        <stringProp name="ThreadGroup.num_threads">100</stringProp>
        <!-- Ramp up to full user load over 30 seconds -->
        <stringProp name="ThreadGroup.ramp_time">30</stringProp>
        <!-- Run test for 5 minutes total -->
        <stringProp name="ThreadGroup.duration">300</stringProp>
        <!-- Enable test duration control -->
        <stringProp name="ThreadGroup.scheduler">true</stringProp>
      </ThreadGroup>
      <hashTree>
        <!-- HTTP request to test the homepage endpoint -->
        <HTTPSamplerProxy guiclass="HttpTestSampleGui" testclass="HTTPSamplerProxy" testname="Homepage Request">
          <!-- Target server domain -->
          <stringProp name="HTTPSampler.domain">example.com</stringProp>
          <!-- Use HTTPS protocol -->
          <stringProp name="HTTPSampler.protocol">https</stringProp>
          <!-- Request the root path -->
          <stringProp name="HTTPSampler.path">/</stringProp>
          <!-- Use GET method -->
          <stringProp name="HTTPSampler.method">GET</stringProp>
        </HTTPSamplerProxy>
        <!-- Collect and summarize test results -->
        <ResultCollector guiclass="SummaryReport" testclass="ResultCollector" testname="Summary Report"/>
      </hashTree>
    </TestPlan>
  </hashTree>
</jmeterTestPlan>
What this example demonstrates: This JMeter test plan simulates 100 users accessing a website homepage over a 30-second ramp-up period, with the test running for a total of 5 minutes. It shows how to configure basic load parameters and capture results in a summary report. This represents a simple baseline performance test to evaluate how your web server handles a moderate user load.
Running test suites
JMeter offers multiple ways to execute test plans:
GUI Mode (for test development):
- Open JMeter GUI
- File → Open → Select your test plan file
- Click the green “Start” button to begin execution
- View real-time results in attached listeners
Non-GUI Mode (for production testing):
# Basic execution
./jmeter.sh -n -t test_plan.jmx -l log.jtl

# With property configuration
./jmeter.sh -n -t test_plan.jmx -l log.jtl -j jmeter.log -Jthreads=200 -Jduration=600

# Generating HTML report after execution
./jmeter.sh -n -t test_plan.jmx -l log.jtl -e -o ./report-output

Distributed Testing: For large-scale tests, JMeter supports distributed testing across multiple machines:
- Start JMeter server on worker machines:
./jmeter-server.sh
- Run the test from the controller:
./jmeter.sh -n -t test_plan.jmx -R worker1,worker2,worker3 -l distributed-results.jtl
Best practices and common pitfalls
- Always include think time: Use the “Timer” elements to simulate realistic user behavior
- Use appropriate assertions: Validate responses beyond just HTTP status codes
- Avoid sharing variables between threads: Use Thread Group-specific variables
- Handle cookies properly: Add HTTP Cookie Manager for stateful applications
- Monitor resource usage: Watch both client and server resources during tests
- Parameterize tests: Use CSV Data Set Config to load test data from external files
- Avoid GUI mode for load testing: The GUI consumes resources and can affect test results
- Start small and scale gradually: Begin with fewer users to establish baseline metrics
Locust

Python-based setup
Locust is a modern load testing framework written in Python that makes creating load tests easy and maintainable. To get started:
- Install Python (3.6 or newer):
- Download from python.org
- Verify installation:
python --version
- Install Locust:
# Using pip pip install locust # Or with specific version pip install locust==2.16.1 # With additional dependencies pip install "locust[opencv]" - Verify installation:
locust --version
Writing test cases
Locust uses Python code to define user behavior, making it highly flexible and maintainable. Key concepts include:
- HttpUser: Base class for simulating HTTP users
- Task: Methods decorated with @task define user behavior
- wait_time: Controls pause between tasks to simulate realistic user behavior
- weight: Controls relative frequency of different tasks
Basic test structure:
from locust import HttpUser, task, between

class WebsiteUser(HttpUser):
    # Time between tasks (1-5 seconds)
    wait_time = between(1, 5)

    @task
    def load_homepage(self):
        self.client.get("/")

    @task(3)  # This task runs 3x more often
    def view_products(self):
        self.client.get("/products")
Running load tests
Locust provides multiple ways to run tests:
Web UI Mode:
# Start with web interface on default port 8089
locust -f locustfile.py

# Specify host
locust -f locustfile.py --host=https://example.com
Headless Mode (for CI/CD pipelines):
# Run with specific parameters
locust -f locustfile.py --headless -u 1000 -r 100 --host=https://example.com -t 5m

# Where:
# -u = number of users
# -r = spawn rate (users started/second)
# -t = test duration
Distributed Mode (for large-scale testing):
- Start a master node:
locust -f locustfile.py --master --expect-workers=4 - Start worker nodes:
locust -f locustfile.py --worker --master-host=192.168.1.100
Code example: Comprehensive test scenario
import random
from locust import HttpUser, task, between, events
from locust.clients import HttpSession

class ShoppingUser(HttpUser):
    """
    Setup method executed when a simulated user starts.
    Here we log in the user before they start shopping.
    """
    wait_time = between(2, 5)

    def on_start(self):
        # Authenticate at the beginning of user session
        self.client.post("/login", {
            "username": f"user_{random.randint(1, 10000)}",  # Generate random username
            "password": "password123"  # Use fixed password for test users
        })
        self.cart_items = []  # Initialize empty shopping cart

    @task(3)  # Higher weight (3) means this task runs more frequently
    def browse_products(self):
        """
        Task that simulates a user browsing product categories.
        Includes extraction of a product ID for use in other tasks.
        """
        # Select a random category to browse
        category_id = random.randint(1, 5)

        # Request with proper error handling and response validation
        with self.client.get(f"/products?category={category_id}",
                             name="/products?category=[id]",  # Group similar URLs in reports
                             catch_response=True) as response:
            if response.status_code == 200:
                response.success()
                # Extract product ID from response for later use
                try:
                    product_data = response.json()
                    if product_data and len(product_data) > 0:
                        random_product = random.choice(product_data)
                        self.product_id = random_product["id"]
                except:
                    pass  # Silently handle parsing errors
            else:
                # Mark request as failed with custom error message
                response.failure(f"Failed to get products: {response.status_code}")

    @task(1)
    def view_product_details(self):
        """
        Task that simulates a user viewing detailed product information.
        Only executes if a product ID was previously obtained.
        """
        # Only proceed if we have a product ID from previous browsing
        if hasattr(self, "product_id"):
            # Access product details using the saved ID
            self.client.get(f"/products/{self.product_id}",
                            name="/products/[id]")  # Group in reports

    @task(1)
    def add_to_cart(self):
        """
        Task that simulates adding a product to the shopping cart.
        """
        if hasattr(self, "product_id"):
            # Add product to cart with error handling
            with self.client.post("/cart/add",
                                  json={"product_id": self.product_id, "quantity": 1},
                                  name="/cart/add",
                                  catch_response=True) as response:
                if response.status_code == 200:
                    # Track added items for later use in checkout
                    self.cart_items.append(self.product_id)
                    response.success()
                else:
                    response.failure(f"Failed to add to cart: {response.status_code}")

    @task(1)
    def view_cart(self):
        """
        Task that simulates viewing the current shopping cart contents.
        Only executes if the cart contains items.
        """
        # Only view cart if it's not empty
        if len(self.cart_items) > 0:
            self.client.get("/cart")

    @task(0.5)  # Lower weight (0.5) means this task runs less frequently
    def checkout(self):
        """
        Task that simulates the complete checkout process.
        Demonstrates a multi-step business process with dependencies.
        """
        # Only checkout if cart has items
        if len(self.cart_items) > 0:
            # Step 1: Initiate checkout process
            self.client.get("/checkout/start")

            # Step 2: Submit shipping information
            self.client.post("/checkout/shipping", json={
                "address": "123 Test St",
                "city": "Test City",
                "zip": "12345"
            })

            # Step 3: Submit payment and complete order
            with self.client.post("/checkout/payment",
                                  json={"payment_method": "credit_card"},
                                  catch_response=True) as response:
                if response.status_code == 200:
                    # Reset cart after successful purchase
                    self.cart_items = []
                    response.success()
                else:
                    # Mark checkout as failed
                    response.failure(f"Checkout failed: {response.status_code}")

# Add custom test events for setup and teardown operations
@events.test_start.add_listener
def on_test_start(environment, **kwargs):
    """Hook that executes when the load test starts"""
    print("Starting test with configuration:", environment.parsed_options)

@events.test_stop.add_listener
def on_test_stop(environment, **kwargs):
    """Hook that executes when the load test completes"""
    print("Test completed. Check reports for details.")
What this example demonstrates: This Locust test script models a complete e-commerce user journey with realistic behaviors and proper state management. It demonstrates how to create interdependent tasks that maintain state between requests, implement proper error handling, use weighted task distribution to create realistic user patterns, and add custom event hooks for test management. The script simulates browsing products, viewing details, managing a shopping cart, and completing a multi-step checkout process—all common operations that would stress different aspects of an e-commerce system.
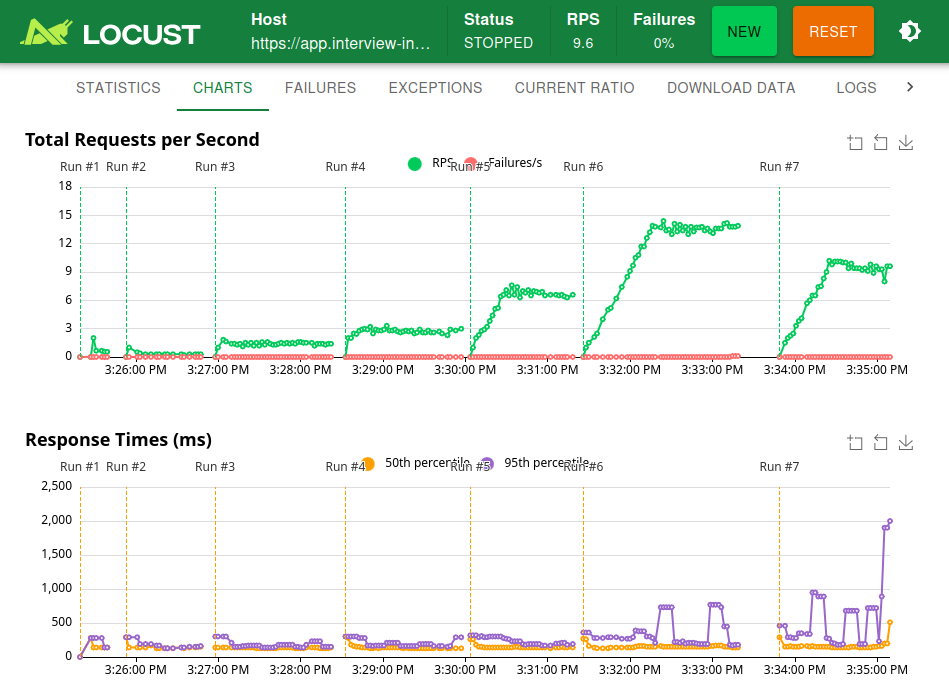
Real-time metrics and reporting
Locust provides a comprehensive web interface for real-time monitoring and analysis:
- Real-time charts: Visualize response times, requests per second, and error rates
- Request statistics: Detailed statistics per endpoint including median, 95th percentile, and max response times
- Failure reporting: Breakdown of request failures by type and frequency
- Export options: Download data as CSV for further analysis or integration with reporting tools
- Charts: Response time distribution, requests per second over time
Command to generate an HTML report after a headless test:
# Run test and generate report
locust -f locustfile.py --headless -u 1000 -r 100 -t 5m --html=report.html
Locust vs. other tools
Locust offers several distinct advantages compared to other load testing frameworks:
- Python ecosystem: Leverage Python’s vast library ecosystem for complex scenarios
- Developer-friendly: Write tests in pure Python code rather than XML or DSL
- Extensibility: Easy to extend with custom functionality and reporting
- Distributed testing: Built-in support for distributed load generation
- Realistic scenarios: Easier to create complex, realistic user behaviors
- Low resource utilization: More efficient than many traditional load testing tools
- Active community: Regular updates and extensive community support
Implementing a Complete Load Testing Strategy
Test Planning and Preparation
Defining test objectives
Establish clear, measurable goals such as response time targets, maximum acceptable error rates, and throughput requirements.
Creating test scenarios
Design realistic user journeys that reflect actual usage patterns and business processes.
Setting up test environment
Create an environment that closely mirrors production, including similar hardware and network configurations.
Data preparation guidelines
Use representative test data that matches production patterns while maintaining data privacy requirements.
Test Execution Framework
Establishing baseline metrics
Establish baseline metrics under normal conditions before proceeding with load tests.
Code example: Progressive load testing
Progressive load testing systematically increases user load to find your application’s performance threshold. This approach helps determine your system’s capacity more precisely than fixed-load tests.
def progressive_load_test(base_url, test_endpoint="/api/products",
                          start_users=10, step_size=10, max_users=200,
                          duration_per_step="5m", ramp_time="30s",
                          response_time_threshold_ms=500, max_error_rate_pct=1.0):
    """
    Executes a series of load tests with progressively increasing user counts
    to identify the point where performance begins to degrade.

    This approach helps establish performance baselines and identifies
    the optimal operational capacity of the system.

    Args:
        base_url: The base URL of the application under test
        test_endpoint: The API endpoint to test
        start_users: Initial number of users to test with
        step_size: How many users to add in each iteration
        max_users: Maximum number of users to test with
        duration_per_step: How long to run each test step
        ramp_time: How gradually to add users in each step
        response_time_threshold_ms: Max acceptable 95th percentile response time
        max_error_rate_pct: Maximum acceptable error rate percentage

    Returns:
        dict: Summary of test results including optimal user count
    """
    print(f"Starting progressive load test against {base_url}{test_endpoint}")
    print(f"Parameters: {start_users}-{max_users} users in steps of {step_size}")

    optimal_load = start_users
    last_good_metrics = None

    # Run tests with progressively increasing user counts
    for users in range(start_users, max_users + 1, step_size):
        print(f"\n[Step {int((users-start_users)/step_size) + 1}] Testing with {users} concurrent users...")

        # Create a test configuration for this load level
        test_config = {
            "url": f"{base_url}{test_endpoint}",
            "users": users,
            "duration": duration_per_step,
            "ramp_up_time": ramp_time
        }

        # Run the test with current configuration
        print(f"  Running test for {duration_per_step}...")
        results = run_load_test(test_config)  # This would call your testing tool's API

        # Analyze results after each iteration to detect degradation
        metrics = analyze_results(results)
        print(f"  Results: {metrics['p95_response_time']}ms (P95), {metrics['error_rate']:.2f}% errors")

        # Save good results for reporting
        if metrics['p95_response_time'] <= response_time_threshold_ms and metrics['error_rate'] <= max_error_rate_pct:
            optimal_load = users
            last_good_metrics = metrics
            print(f"  ✓ Performance within acceptable thresholds")

        # Check if performance thresholds have been exceeded
        if metrics['p95_response_time'] > response_time_threshold_ms or metrics['error_rate'] > max_error_rate_pct:
            print(f"  ⚠ Performance degradation detected at {users} users:")
            print(f"    - 95th percentile response time: {metrics['p95_response_time']}ms (threshold: {response_time_threshold_ms}ms)")
            print(f"    - Error rate: {metrics['error_rate']:.2f}% (threshold: {max_error_rate_pct}%)")
            print(f"  ✓ Optimal load determined: {optimal_load} users")
            break

        # Save detailed results for later analysis
        save_test_results(f"load_test_{users}_users.json", metrics)

    # Generate final report
    print("\nProgressive load test complete.")
    print(f"Optimal user capacity: {optimal_load} users")
    if last_good_metrics:
        print(f"At optimal capacity:")
        print(f"- Throughput: {last_good_metrics['throughput']:.2f} requests/second")
        print(f"- P95 response time: {last_good_metrics['p95_response_time']}ms")
        print(f"- Error rate: {last_good_metrics['error_rate']:.2f}%")

    return {
        "optimal_user_count": optimal_load,
        "metrics_at_optimal": last_good_metrics
    }
How to implement progressive load testing
You can integrate this function with your existing testing framework in several ways:
- As a standalone script: Create a script that imports your testing tool’s library (Locust, JMeter API, etc.) and calls this function:
# progressive_load_test.py
import argparse
from locust import HttpUser, task, between, runners
import json

# Import the progressive_load_test function from above

def setup_locust_test(config):
    """Set up and run a Locust test based on configuration"""
    # Define a simple Locust user class for the test
    class TestUser(HttpUser):
        wait_time = between(1, 2)

        @task
        def test_endpoint(self):
            self.client.get(config["endpoint"])

    # Configure and run Locust in headless mode
    runner = runners.LocalRunner()
    runner.start(TestUser, config["users"], spawn_rate=config["users"]/30)
    runner.stats.reset_all()

    # Run for specified duration
    time.sleep(parse_duration(config["duration"]))

    # Collect and return results
    stats = runner.stats.serialize_stats()
    runner.stop()
    return stats

def run_load_test(config):
    return setup_locust_test({
        "endpoint": config["url"],
        "users": config["users"],
        "duration": config["duration"]
    })

def analyze_results(results):
    # Process Locust results
    total_requests = sum(req["num_requests"] for req in results.values())
    total_failures = sum(req["num_failures"] for req in results.values())
    error_rate = (total_failures / total_requests * 100) if total_requests > 0 else 0

    # Calculate P95 across all requests
    p95 = max(req["response_times_percentiles"]["0.95"] for req in results.values()
              if "response_times_percentiles" in req and "0.95" in req["response_times_percentiles"])

    # Calculate throughput
    test_duration_sec = results["duration"] if "duration" in results else 60
    throughput = total_requests / test_duration_sec

    return {
        "p95_response_time": p95,
        "error_rate": error_rate,
        "throughput": throughput,
        "total_requests": total_requests
    }

def save_test_results(filename, metrics):
    with open(filename, 'w') as f:
        json.dump(metrics, f, indent=2)

# Parse command line arguments
if __name__ == "__main__":
    parser = argparse.ArgumentParser(description='Run progressive load test')
    parser.add_argument('--url', required=True, help='Base URL to test')
    parser.add_argument('--endpoint', default='/api/products', help='Endpoint to test')
    parser.add_argument('--start', type=int, default=10, help='Starting user count')
    parser.add_argument('--step', type=int, default=10, help='User count increment')
    parser.add_argument('--max', type=int, default=200, help='Maximum user count')
    parser.add_argument('--rt-threshold', type=int, default=500,
                        help='Response time threshold in ms')
    args = parser.parse_args()

    # Run the progressive load test
    results = progressive_load_test(
        args.url, args.endpoint,
        start_users=args.start,
        step_size=args.step,
        max_users=args.max,
        response_time_threshold_ms=args.rt_threshold
    )

    # Save summary report
    save_test_results("progressive_test_summary.json", results)
- Integrated with your CI/CD pipeline: Add this to your existing testing workflow:
# Example GitHub Actions workflow
name: Performance Testing

on:
  push:
    branches: [ main ]
  pull_request:
    branches: [ main ]

jobs:
  load-test:
    runs-on: ubuntu-latest
    steps:
    - uses: actions/checkout@v3
    - name: Set up Python
      uses: actions/setup-python@v4
      with:
        python-version: '3.10'
    - name: Install dependencies
      run: |
        python -m pip install --upgrade pip
        pip install locust matplotlib
    - name: Run progressive load test
      run: |
        python progressive_load_test.py --url https://staging-api.example.com --max 100
    - name: Archive test results
      uses: actions/upload-artifact@v3
      with:
        name: load-test-results
        path: |
          load_test_*.json
          progressive_test_summary.json
- Visualize the results: Create graphs showing how response time and error rates change with increasing load:
def generate_load_test_report(test_results_dir="."):
    """Generate visual report from progressive load test results"""
    import matplotlib.pyplot as plt
    import json
    import glob
    import os

    # Find all result files
    result_files = glob.glob(os.path.join(test_results_dir, "load_test_*_users.json"))

    # Extract user counts and metrics
    user_counts = []
    response_times = []
    error_rates = []
    throughputs = []

    for file in sorted(result_files, key=lambda x: int(x.split('_')[-2])):
        user_count = int(file.split('_')[-2])
        with open(file, 'r') as f:
            data = json.load(f)

        user_counts.append(user_count)
        response_times.append(data.get('p95_response_time', 0))
        error_rates.append(data.get('error_rate', 0))
        throughputs.append(data.get('throughput', 0))

    # Create the visualization
    fig, (ax1, ax2, ax3) = plt.subplots(3, 1, figsize=(10, 15))

    # Response time graph
    ax1.plot(user_counts, response_times, 'b-o')
    ax1.set_title('P95 Response Time vs User Count')
    ax1.set_ylabel('Response Time (ms)')
    ax1.grid(True)

    # Error rate graph
    ax2.plot(user_counts, error_rates, 'r-o')
    ax2.set_title('Error Rate vs User Count')
    ax2.set_ylabel('Error Rate (%)')
    ax2.grid(True)

    # Throughput graph
    ax3.plot(user_counts, throughputs, 'g-o')
    ax3.set_title('Throughput vs User Count')
    ax3.set_xlabel('Number of Concurrent Users')
    ax3.set_ylabel('Requests per Second')
    ax3.grid(True)

    plt.tight_layout()
    plt.savefig('progressive_load_test_report.png')
    print(f"Generated report: progressive_load_test_report.png")
Benefits of this approach
This progressive load testing approach offers several advantages:
- Efficient resource usage: Tests run only until performance begins to degrade
- Clear capacity limits: Automatically identifies optimal user capacity
- Early warning: Detects performance issues before they impact users
- Continuous optimization: Compare results between code changes to track improvements
- Data-driven scaling: Use results to inform infrastructure scaling decisions
By incorporating progressive load testing into your regular testing cycle, you can proactively monitor how application changes impact performance thresholds and ensure your infrastructure scaling aligns with actual capacity needs rather than theoretical estimates.
Monitoring and data collection
Implement comprehensive monitoring covering application, database, and infrastructure metrics.
Installing Prometheus and Grafana with Docker Compose: A Comprehensive Guide
Results Analysis and Reporting
Data interpretation
Analyze trends, patterns, and anomalies in collected metrics to identify performance bottlenecks.
Performance bottleneck identification
Use correlation analysis to link symptoms with root causes.
Conclusion
As we’ve explored throughout this guide, effective load and scale testing is essential for modern web applications facing unprecedented performance challenges. The tools and methodologies we’ve discussed provide a comprehensive framework for ensuring your applications can handle real-world demands.
Tool Comparison Matrix
| Tool | Language | Learning Curve | Scalability | Reporting |
|---|---|---|---|---|
| JMeter | Java | Medium | Good | Excellent |
| Locust | Python | Low | Good | Good |