Using Ipywidgets in Jupyter Notebooks
Introduction to Ipywidgets
Ipywidgets are a powerful tool that can enhance the interactivity and functionality of Jupyter Notebooks. These widgets allow users to create interactive elements such as sliders, buttons, dropdown menus, and text boxes, making it easier to visualize data, manipulate parameters, and customize the user experience.
With ipywidgets, you can create dynamic and responsive interfaces without having to write complex JavaScript or HTML code. These widgets are designed to work seamlessly within Jupyter Notebooks, allowing you to interact with your data in real-time and explore different scenarios with ease.
Widgets can be used for a variety of purposes, from simple data visualization to creating complex forms and input fields. For example, you can use a slider widget to adjust the parameters of a plot, a dropdown menu to select different datasets, or a text box to input custom values. These widgets can be combined and arranged in different layouts to create intuitive and user-friendly interfaces.
One of the key features of ipywidgets is their ability to update dynamically based on user input. This means that you can create interactive visualizations that respond in real-time to changes made by the user. For instance, you can create a scatter plot that updates as you adjust the slider values, or a form that displays different options based on the selections made by the user.
In the following sections, we will explore some examples of how to use ipywidgets in Jupyter Notebooks, including how to create different types of widgets, arrange them in layouts, create forms and input fields, and update them dynamically. Let’s dive in and see how ipywidgets can take your Jupyter Notebooks to the next level.
Examples of Widgets
Widgets are the building blocks of interactive user interfaces in Jupyter Notebooks. They allow users to interact with and manipulate data in real-time, making data exploration and analysis more intuitive and engaging. In this section, we will explore some examples of widgets that you can use in your Jupyter Notebooks, along with working code samples.
Text and Numeric Input Widgets
Text and numeric input widgets allow users to enter data directly. Here are examples of the Text and IntSlider widgets:
import ipywidgets as widgets
from IPython.display import display

# Text widget
text_widget = widgets.Text(
    value='',
    placeholder='Type something',
    description='Text:',
    disabled=False
)

# Integer Slider widget
int_slider = widgets.IntSlider(
    value=7,
    min=0,
    max=10,
    step=1,
    description='Number:',
    disabled=False,
    continuous_update=False,
    orientation='horizontal',
    readout=True,
    readout_format='d'
)

display(text_widget, int_slider)

Button Widgets
Button widgets can trigger actions when clicked. Here’s an example of a Button widget:
button = widgets.Button(
    description='Click me!',
    disabled=False,
    button_style='', # 'success', 'info', 'warning', 'danger' or ''
    tooltip='Click me',
    icon='check' # (FontAwesome names without the `fa-` prefix)
)

def on_button_clicked(b):
    print("Button clicked!")

button.on_click(on_button_clicked)

display(button)

Dropdown and Selection Widgets
Dropdown and selection widgets allow users to choose from a list of options. Here are examples of Dropdown and SelectMultiple widgets:
# Dropdown widget
dropdown = widgets.Dropdown(
    options=['Option 1', 'Option 2', 'Option 3'],
    value='Option 1',
    description='Choose:',
    disabled=False,
)

# SelectMultiple widget
select_multiple = widgets.SelectMultiple(
    options=['Apple', 'Banana', 'Cherry'],
    value=['Apple'],
    description='Fruits:',
    disabled=False
)

display(dropdown, select_multiple)

Output Widgets
Output widgets display the result of operations or code execution. Here’s an example:
output = widgets.Output()

with output:
    print("This text is displayed in the output widget")

display(output)

Interactive Plotting Widgets
You can create interactive plots that update based on widget values. Here’s an example using Matplotlib:
import matplotlib.pyplot as plt
import numpy as np
from ipywidgets import interactive

def plot_sine(frequency, amplitude):
    x = np.linspace(0, 10, 1000)
    y = amplitude * np.sin(frequency * x)
    plt.figure(figsize=(10, 5))
    plt.plot(x, y)
    plt.ylim(-1, 1)
    plt.title(f'Sine Wave (Frequency: {frequency}, Amplitude: {amplitude})')
    plt.xlabel('x')
    plt.ylabel('y')
    plt.grid(True)
    plt.show()

interactive_plot = interactive(plot_sine,
                               frequency=(0.1, 2, 0.1),
                               amplitude=(0.1, 1, 0.1))
display(interactive_plot)

These examples demonstrate various types of widgets you can use in your Jupyter Notebooks. From text and numeric input widgets to button widgets and interactive plotting widgets, there are endless possibilities for enhancing the interactivity and usability of your notebooks.
In the next section, we will delve into different layouts and forms that you can create using ipywidgets to further customize your user interfaces.
Layouts in ipywidgets
Layouts in ipywidgets play a crucial role in organizing and structuring the widgets within your Jupyter Notebook. They allow you to control the placement and alignment of widgets, making your interactive visualizations more user-friendly and aesthetically pleasing.
Types of Layouts
There are several types of layouts available in ipywidgets, including:
- HBox (Horizontal Box): This layout arranges widgets in a horizontal line.
- VBox (Vertical Box): Widgets are stacked vertically in this layout.
- GridBox: Allows you to create a grid-like layout for widgets.
- Accordion: A layout that displays widgets in a collapsible accordion style.
- Tab: Widgets are organized in tabs, making it easy to switch between different sets of widgets.
Example of Layouts
Let’s consider a simple example where we have a text input widget and a button widget that triggers an action when clicked. We can use the VBox layout to stack these widgets vertically:
import ipywidgets as widgets
from IPython.display import display

slider = widgets.IntSlider(
    value=5,
    min=0,
    max=10,
    step=1,
    description='Slider:',
    continuous_update=False
)
button = widgets.Button(description='Submit')
button.layout.width = '200px'
slider.layout.margin = '10px'
vbox = widgets.VBox([slider, button])
display(vbox)
In this example, the text input widget and the button widget are displayed one below the other, thanks to the VBox layout.

Customizing Layouts
You can further customize layouts by adjusting spacing, alignment, and sizing of widgets within the layout. For example, you can use the layout attribute of widgets to set specific styling properties such as margin, padding, width, and height.
button.layout.width = '200px'
slider.layout.margin = '10px'
By tweaking these layout properties, you can create a visually appealing and well-organized interface for your interactive widgets.
In the next section, we will explore how to create forms and handle user input using ipywidgets. Stay tuned for more examples and tips on enhancing your Jupyter Notebook with interactive elements.
Tabs and Accordions
Tabs and Accordions are useful for organizing content and reducing clutter in your Jupyter Notebooks. They allow you to group related widgets or content together, making your interface more manageable and user-friendly.
Tabs
Tabs allow you to organize content into separate panes that users can switch between. Here’s an example of how to create tabs:
import ipywidgets as widgets

tab1 = widgets.Text(description='Text 1:')
tab2 = widgets.IntSlider(description='Slider:')
tab3 = widgets.Dropdown(options=['A', 'B', 'C'], description='Dropdown:')

tab = widgets.Tab()
tab.children = [tab1, tab2, tab3]
tab.titles = ['Text', 'Slider', 'Dropdown']

display(tab)

Accordions
Accordions are similar to tabs but allow for vertical stacking of collapsible sections. Here’s an example:
accordion = widgets.Accordion(children=[tab1, tab2, tab3])
accordion.titles = ('Text', 'Slider', 'Dropdown')
display(accordion)

Forms/Input Controls
Forms and input controls are essential components when creating interactive Jupyter Notebooks using ipywidgets. These controls allow users to input data, make selections, and interact with the widgets in a meaningful way. Let’s explore some of the common forms and input controls available in ipywidgets.
Text Input
One of the simplest forms of input controls is the Text widget. This widget allows users to input text data into a field. You can set the initial value, placeholder text, and even restrict the input length or format. Text inputs are versatile and can be used for various purposes, such as collecting user feedback or entering search queries.
text_input = widgets.Text(
    value='',
    placeholder='Type something',
    description='String:',
    disabled=False
)
display(text_input)

Dropdown Menus
Dropdown menus are another popular input control that provides users with a list of options to choose from. With ipywidgets, you can create dropdown menus with static options or dynamically generate options based on certain conditions. Dropdown menus are great for presenting users with a set of choices and can be used for tasks like selecting categories or filtering data.
dropdown = widgets.Dropdown(
    options=['Option 1', 'Option 2', 'Option 3'],
    value='Option 1',
    description='Choose:',
)

Sliders
Sliders are interactive input controls that allow users to select a value within a specified range by sliding a handle along a track. Sliders are useful for setting numerical parameters, such as adjusting the size of an image or controlling the speed of an animation. You can customize sliders by setting the minimum and maximum values, step size, and orientation.
slider = widgets.IntSlider(
    value=7,
    min=0,
    max=10,
    step=1,
    description='Number:',
    disabled=False,
    continuous_update=False,
    orientation='horizontal',
    readout=True,
    readout_format='d'
)

Checkboxes
Checkboxes are input controls that allow users to toggle between two states: checked and unchecked. Checkboxes are commonly used for binary choices, such as enabling or disabling a feature or selecting multiple items from a list. With ipywidgets, you can create single checkboxes or checkbox groups to handle multiple selections.
checkbox = widgets.Checkbox(
    value=False,
    description='Check me',
    disabled=False,
    indent=False
)

Forms
Forms are a collection of input controls grouped together to create a structured layout for user input. Forms can include a combination of text inputs, dropdown menus, sliders, checkboxes, and other widgets. By organizing input controls into a form, you can create a user-friendly interface for collecting data or configuring settings.
form = widgets.VBox([text_input, dropdown, slider, checkbox])
display(form)

In the next section, we will explore how to dynamically update widgets based on user input and create interactive visualizations using ipywidgets. Stay tuned for more examples and tips on leveraging the power of ipywidgets in your Jupyter Notebooks.
Dynamic Updating
Dynamic updating is a powerful feature of ipywidgets that allows you to create interactive elements that respond to user input in real-time. This capability can greatly enhance the user experience and make your Jupyter Notebooks more engaging and interactive.
Observing Widget Changes
One common use case for dynamic updating is creating widgets that update their values based on the input from other widgets. This can be achieved using the observe method, which allows you to specify a callback function that is called whenever the value of a widget changes.
import ipywidgets as widgets

slider = widgets.IntSlider()
text = widgets.Text()

def update_text(change):
    text.value = str(slider.value)

slider.observe(update_text, 'value')

widgets.VBox([slider, text])
In this example, the update_text function is called whenever the value of the slider widget changes, updating the value of the text widget to match. This creates a dynamic relationship between the two widgets, allowing them to interact with each other in real-time.
Using the Interact Function
Another way to achieve dynamic updating is by using the interact function, which automatically generates widgets based on the arguments of a function. This can be a convenient way to create interactive elements that update dynamically based on user input.
from ipywidgets import interact

def square(x):
    return x * x

interact(square, x=widgets.IntSlider(min=0, max=10, step=1))

In this example, the square function takes a single argument x and returns the square of that value. By using the interact function with an IntSlider widget, we create a dynamic relationship where the output of the function updates automatically as the user moves the slider.
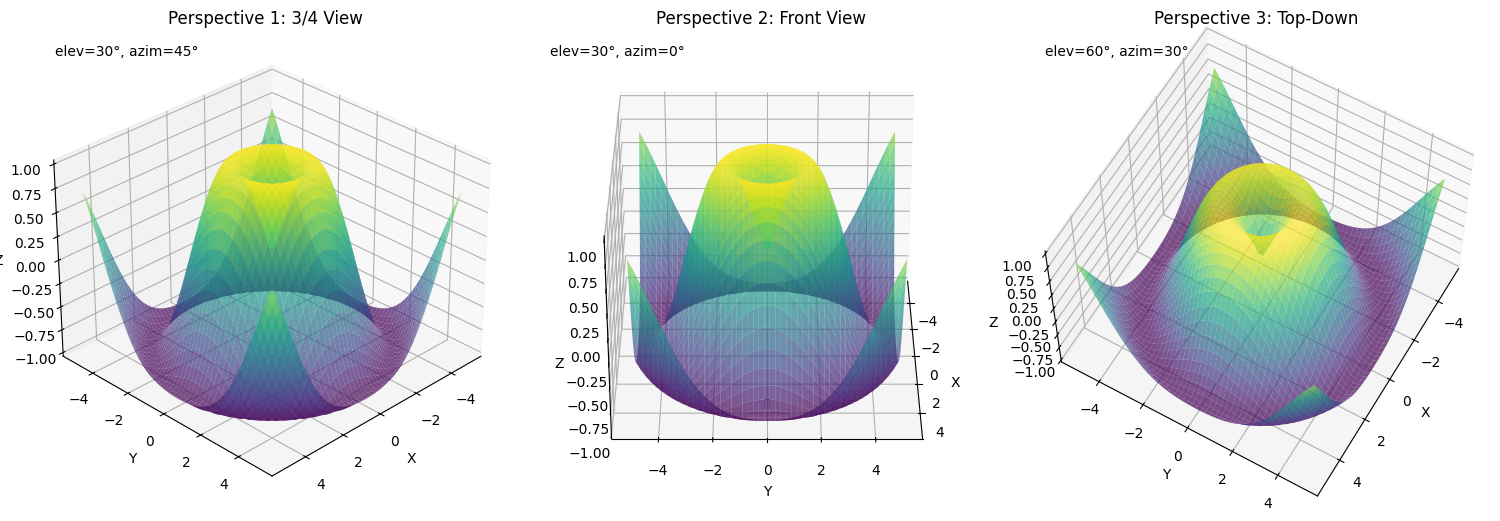
Interactive Visualizations
Dynamic updating can also be used to create more complex interactive elements, such as interactive plots that update based on user input. By combining widgets with plotting libraries like Matplotlib or Plotly, you can create interactive visualizations that respond to user interactions in real-time.
import ipywidgets as widgets
import matplotlib.pyplot as plt
import numpy as np
from IPython.display import display, clear_output

# Create a figure and an output widget for better control
output = widgets.Output()
plt.figure(figsize=(8, 6))

# Create a slider widget
slider = widgets.IntSlider(
    value=1,
    min=1,
    max=10,
    step=1,
    description='Multiplier:'
)

# Define a function to update the plot
def update_plot(change):
    # If change is a dictionary, get the value directly
    if isinstance(change, dict):
        exponent = change['new']
    else:
        # Otherwise it's a proper widget change object
        exponent = change.new

    with output:
        # Clear previous output
        clear_output(wait=True)

        # Create a new plot
        plt.figure(figsize=(8, 6))
        x = np.linspace(0, 10, 100)
        y = x ** exponent
        plt.plot(x, y)
        plt.xlabel('x')
        plt.ylabel('y')
        plt.title(f'y = x^{exponent}')
        plt.grid(True)
        plt.show()

# Connect the slider to the update function
slider.observe(update_plot, 'value')

# Display the slider and output area
display(widgets.VBox([slider, output]))

# Generate initial plot
update_plot({'new': 1})

In this example, we create an interactive plot that updates based on the value of a slider widget. As the user adjusts the slider, the plot updates in real-time to show different power functions.
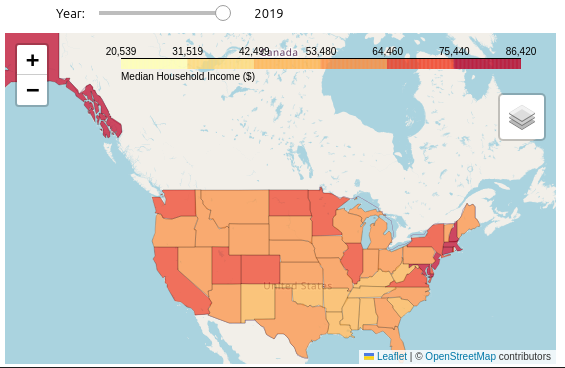
Creating Interactive Choropleth Maps with censusdata and folium
In this section, we’ll put our learnings together to create an interactive choropleth map using the censusdata module to fetch data and folium to create the map. We’ll visualize median household income across different states in the US.
First, let’s install the required libraries:
%pip install censusdata folium
Now, let’s create our interactive map:
import censusdata
import folium
import pandas as pd
import ipywidgets as widgets
from IPython.display import display

# FIPS to state postal code mapping
fips_to_abbr = {
    '01': 'AL', '02': 'AK', '04': 'AZ', '05': 'AR', '06': 'CA', '08': 'CO', '09': 'CT',
    '10': 'DE', '11': 'DC', '12': 'FL', '13': 'GA', '15': 'HI', '16': 'ID', '17': 'IL',
    '18': 'IN', '19': 'IA', '20': 'KS', '21': 'KY', '22': 'LA', '23': 'ME', '24': 'MD',
    '25': 'MA', '26': 'MI', '27': 'MN', '28': 'MS', '29': 'MO', '30': 'MT', '31': 'NE',
    '32': 'NV', '33': 'NH', '34': 'NJ', '35': 'NM', '36': 'NY', '37': 'NC', '38': 'ND',
    '39': 'OH', '40': 'OK', '41': 'OR', '42': 'PA', '44': 'RI', '45': 'SC', '46': 'SD',
    '47': 'TN', '48': 'TX', '49': 'UT', '50': 'VT', '51': 'VA', '53': 'WA', '54': 'WV',
    '55': 'WI', '56': 'WY'
}

# Fetch data from Census API
def get_census_data(year):
    data = censusdata.download(
        'acs5', year,
        censusdata.censusgeo([('state', '*')]),
        ['B19013_001E']
    )
    data.columns = ['Median Household Income']
    data = data.reset_index()
    # Extract FIPS code from censusgeo object
    data['fips'] = data['index'].apply(lambda x: x.params()[0][1])
    # Map FIPS to state postal code
    data['state'] = data['fips'].map(fips_to_abbr)
    return data

# Create choropleth map
def create_map(year):
    data = get_census_data(year)
    m = folium.Map(location=[48, -102], zoom_start=3)
    folium.Choropleth(
        geo_data='https://raw.githubusercontent.com/python-visualization/folium/master/examples/data/us-states.json',
        name='choropleth',
        data=data,
        columns=['state', 'Median Household Income'],
        key_on='feature.id',  # feature.id is the state postal code
        fill_color='YlOrRd',
        fill_opacity=0.7,
        line_opacity=0.2,
        legend_name='Median Household Income ($)'
    ).add_to(m)
    folium.LayerControl().add_to(m)
    return m

# Create interactive widget
year_slider = widgets.IntSlider(
    value=2019,
    min=2010,
    max=2019,
    step=1,
    description='Year:',
    continuous_update=False
)

# Display map
out = widgets.Output()

def update_map(change):
    year = change['new']
    with out:
        out.clear_output()
        display(create_map(year))

year_slider.observe(update_map, names='value')

display(year_slider, out)
update_map({'new': 2019})  # Initial display

This code creates an interactive choropleth map of the United States, showing median household income by state. Users can adjust the year using a slider widget, and the map will update accordingly.
Conclusion
Dynamic updating is a key feature of ipywidgets that enables you to create interactive and responsive interfaces within your Jupyter Notebooks. By leveraging this capability, you can build engaging data visualizations, interactive forms, and dynamic applications that respond to user input in real-time.
Throughout this blog post, we’ve explored various aspects of using ipywidgets in Jupyter Notebooks, including different types of widgets, layouts, forms and input controls, and dynamic updating. By combining these features, you can create powerful and interactive data analysis tools that enhance the user experience and make your Jupyter Notebooks more engaging and informative.
We encourage you to experiment with these techniques and explore the full potential of ipywidgets in your own projects.