Interactive Mapping with Python: Building a Transit Visualization using Folium
Folium makes it easy to create beautiful interactive web maps in Python by combining the power of Python’s data handling with the Leaflet.js mapping library. While there are many ways to showcase Folium’s capabilities, building a transit system visualization provides a perfect practical example – combining real world data and various layer types.
In this tutorial, we’ll explore Folium’s key features by building an interactive map of Atlanta’s MARTA transit system. You’ll learn how to:
- Process GTFS (General Transit Feed Specification) files provided by transit systems.
- Create base maps with custom tiles and styling
- Add multiple data layers (points, lines, polygons)
- Build interactive markers and popups
- Implement marker clustering for better performance
- Customize map controls and legends
We’ll use GTFS (General Transit Feed Specification) transit data as our example dataset, but the mapping techniques we’ll cover apply broadly to any geographic visualization needs – from plotting business locations to tracking delivery routes.
Let’s get started by setting up our Python environment and exploring Folium’s basic capabilities.
Prerequisites
Before starting this tutorial, ensure you have:
- Python Development Environment
- A Jupyter-capable environment like VS Code
- See our guide: Getting Started with Jupyter Notebooks in VS Code
- Required Python Libraries
pip install folium pip install pandas - GTFS Data
- Download MARTA’s GTFS data from their Developer Resources page
- Required files from the downloaded zip file:
- routes.txt
- stops.txt
- trips.txt
- stop_times.txt
- Unzip the downloaded file and note the location, we’ll configure the notebook with the path to the files.
- Required files from the downloaded zip file:
Setting Up the Environment
Let’s begin by creating a new Jupyter notebook and setting up our working environment. First, create a new notebook called transit_mapping.ipynb in your project directory.
Start with a markdown cell that documents the notebook’s purpose. I always like to start my notebooks with an overview of what we’ll be doing and information required. Create a new markdown cell at the top of the notebook and paste the following block.
Transit System Mapping with Folium
----------------------------------
This notebook demonstrates interactive mapping using Folium and GTFS data.
We'll create a visualization of MARTA's transit system in Atlanta.

Required data:
- [MARTA GTFS Data](https://www.itsmarta.com/app-developer-resources.aspx)
  - Download the latest GTFS feed (.zip file)
  - Extract into a `data` directory in your project folder
  - Required files: routes.txt, stops.txt, trips.txt, stop_times.txt
Configuring the Notebook
This first python cell is used for setup and configuration. Insert the code block in a new python cell in the notebook.
import folium
from folium.plugins import MarkerCluster
import pandas as pd
import os

# Configure global variables
TRANSIT_FILES_LOCATION = "data"  # Directory containing GTFS files
MAP_CENTER = [33.7490, -84.3880]  # Atlanta's approximate center
MAP_ZOOM = 10

# GTFS file paths
ROUTES_FILE = os.path.join(TRANSIT_FILES_LOCATION, "routes.txt")
STOPS_FILE = os.path.join(TRANSIT_FILES_LOCATION, "stops.txt")
TRIPS_FILE = os.path.join(TRANSIT_FILES_LOCATION, "trips.txt")
STOP_TIMES_FILE = os.path.join(TRANSIT_FILES_LOCATION, "stop_times.txt")

# Define colors for different route types
ROUTE_TYPE_COLORS = {
    0: "#FF0000",  # Light Rail - Red
    1: "#0000FF",  # Subway/Metro - Blue
    2: "#00FF00",  # Rail - Green
    3: "#FFA500"   # Bus - Orange
}
This initial code block sets up our Python environment with the necessary tools and configurations for mapping MARTA’s transit system. We’ll cover each section of this cell in detail starting with importing the libraries we’re going to use in the notebook.
# Required Libraries
import folium               # Creates interactive maps
from folium.plugins import MarkerCluster  # Groups nearby markers for better visualization
import pandas as pd        # Handles our GTFS data files
import os                  # Manages file paths
The code then defines several key configuration variables:
- Base Configuration:
TRANSIT_FILES_LOCATION: Points to the “data” directory containing our GTFS filesMAP_CENTER: Sets Atlanta’s downtown coordinates [33.7490, -84.3880] as our map’s centerMAP_ZOOM: Defines initial zoom level (10) for a city-wide view
- GTFS File Paths:
ROUTES_FILE = os.path.join(TRANSIT_FILES_LOCATION, "routes.txt") STOPS_FILE = os.path.join(TRANSIT_FILES_LOCATION, "stops.txt") TRIPS_FILE = os.path.join(TRANSIT_FILES_LOCATION, "trips.txt") STOP_TIMES_FILE = os.path.join(TRANSIT_FILES_LOCATION, "stop_times.txt")
These variables create proper file paths to our GTFS data files, which contain information about routes, stops, trips, and schedules.
- Route Type Colors:
ROUTE_TYPE_COLORS = {0: "#FF0000", # Light Rail - Red1: "#0000FF", # Subway/Metro - Blue2: "#00FF00", # Rail - Green3: "#FFA500" # Bus - Orange}
This dictionary maps GTFS route types to specific colors, making different transit modes visually distinct on our map. The numbers (0-3) correspond to standard GTFS route type codes. We use a dictionary here instead of a list so we can use the get method on the object later to retrieve the color from the route type code.
We’ll also create a function to verify the environment is setup and the GTFS files are in place. Create a new python cell and insert the following code. This code simply verifies all the expected files we’re going to use exist.
def verify_environment():
    required_files = [ROUTES_FILE, STOPS_FILE, TRIPS_FILE, STOP_TIMES_FILE]
    for file in required_files:
        if not os.path.exists(file):
            raise FileNotFoundError(f"Missing required file: {file}")
    print("Environment setup complete - all files found")

verify_environment()
With this foundation in place, we’re ready to begin processing the GTFS data and creating our interactive map.
Working with GTFS Data
Now that our environment is set up, let’s explore how to work with GTFS (General Transit Feed Specification) data. GTFS is a standardized format for public transportation schedules and associated geographic information.
Understanding GTFS Files
Let’s load and process each file. The GTFS files are CSV which allows us to easily read them in with Pandas read_csv function. We read each file and print out the number of routes, stops, and trips found as well as preview the routes dataframe. Create a new python cell and add the following code.
# Load routes data
routes_df = pd.read_csv(ROUTES_FILE)
print(f"Loaded {len(routes_df)} transit routes")

# Load stops data
stops_df = pd.read_csv(STOPS_FILE)
print(f"Loaded {len(stops_df)} transit stops")

# Load trips data
trips_df = pd.read_csv(TRIPS_FILE)
print(f"Loaded {len(trips_df)} transit trips")

# Preview the routes data
print("\nRoutes Preview:")
print(routes_df[["route_id", "route_short_name", "route_long_name"]].head())
Processing GTFS Data
The raw GTFS data needs some cleaning and processing before we can use it effectively. Append another python cell and insert this code block:
# First, rename columns in routes_df
routes_df = routes_df.rename(columns={
    "route_id": "ROUTE_ID",
    "route_short_name": "NAME",
    "route_long_name": "DESCRIPTION"
})

# Now rename columns in trips_df
trips_df = trips_df.rename(columns={
    "route_id": "ROUTE_ID",
    "trip_id": "TRIP_ID"
})

# Clean up stops data
stops_df = stops_df.rename(columns={
    "stop_id": "STOP_ID",
    "stop_name": "NAME",
    "stop_lat": "LAT",
    "stop_lon": "LON"
})

# Add route type labels
ROUTE_TYPES = {
    0: "Light Rail",
    1: "Subway/Metro",
    2: "Rail",
    3: "Bus"
}
routes_df["TYPE"] = routes_df["route_type"].map(ROUTE_TYPES)

# Verify the merge columns exist
print("\nVerifying ROUTE_ID in both dataframes:")
print("ROUTE_ID in routes_df:", "ROUTE_ID" in routes_df.columns)
print("ROUTE_ID in trips_df:", "ROUTE_ID" in trips_df.columns)

# Now try the merge
trips_df = trips_df.merge(
    routes_df[["ROUTE_ID", "NAME", "TYPE"]],
    on="ROUTE_ID",
    how="left"
)
This cell does some data standardization and cleanup which helps by providing consistent naming and combines route information with trip data.
- Column Standardization
- Renames columns across three dataframes (
routes_df,trips_df,stops_df) to use consistent, uppercase naming - Makes column names more intuitive (e.g.,
stop_lat→LAT) - Creates common join keys (
ROUTE_ID) across dataframes
- Renames columns across three dataframes (
- Route Type Classification
- Creates a mapping dictionary
ROUTE_TYPESthat converts numeric codes to human-readable transit types - Uses pandas’
map()function to add a newTYPEcolumn toroutes_df - Translates codes: 0=Light Rail, 1=Subway/Metro, 2=Rail, 3=Bus
- Creates a mapping dictionary
- Data Merging
- Verifies merge columns exist in both dataframes (debugging step)
- Performs a left join between
trips_dfandroutes_df - Selects only needed columns (
ROUTE_ID,NAME,TYPE) fromroutes_df - Preserves all records from
trips_dfwhile adding route information
Handling Trip Schedules
Trip schedules connect routes, stops, and timing information. Let’s process this data in a new python cell:
# Load and process stop times
stop_times_df = pd.read_csv(STOP_TIMES_FILE)
stop_times_df = stop_times_df.rename(columns={
    "trip_id": "TRIP_ID",
    "stop_id": "STOP_ID",
    "arrival_time": "ARRIVAL",
    "departure_time": "DEPARTURE"
})

# First merge to get route info into trips
trips_df = trips_df.merge(
    routes_df[["ROUTE_ID", "NAME", "TYPE"]],
    on="ROUTE_ID",
    how="left"
)

# Verify the merge created the columns
print("Columns after merge:", trips_df.columns.tolist())

# Then create schedule summary
schedule_summary = stop_times_df.merge(
    trips_df[["TRIP_ID", "ROUTE_ID"]], # Use only columns we know exist
    on="TRIP_ID",
    how="left"
)

# Finally, add route information
schedule_summary = schedule_summary.merge(
    routes_df[["ROUTE_ID", "NAME", "TYPE"]],
    on="ROUTE_ID",
    how="left"
)
- Loading and Standardizing Stop Times
stop_times_df = pd.read_csv(STOP_TIMES_FILE)
stop_times_df = stop_times_df.rename(columns={...})
- Loads the stop_times.txt file into a DataFrame
- Standardizes column names to uppercase format
- Adding Route Information to Trips
trips_df = trips_df.merge(
    routes_df[["ROUTE_ID", "NAME", "TYPE"]],
    on="ROUTE_ID",
    how="left"
)
- Merges trip data with route information
- Uses a left join to preserve all trips
- Adds route name and type to each trip
- Creating a Complete Schedule Summary
# First merge: Stops with Trips
schedule_summary = stop_times_df.merge(
    trips_df[["TRIP_ID", "ROUTE_ID"]],
    on="TRIP_ID",
    how="left"
)

# Second merge: Adding Route Details
schedule_summary = schedule_summary.merge(
    routes_df[["ROUTE_ID", "NAME", "TYPE"]],
    on="ROUTE_ID",
    how="left"
)
- Creates a comprehensive view linking stops, trips, and routes
- Uses two sequential merges to build the complete picture
- Final dataset contains stop times with associated route information
The resulting schedule_summary DataFrame contains all stop times enriched with route details, useful for mapping transit system schedules.
Creating Route-Stop Relationships
To map routes effectively, we need to understand which stops belong to each route:
def create_route_stop_mapping():
    """Create a mapping of routes to their stops in sequence"""
    # Join stop_times with trips to get route information
    route_stops = stop_times_df.merge(
        trips_df[["TRIP_ID", "ROUTE_ID"]],
        on="TRIP_ID",
        how="left"
    )

    # Join with stops to get stop locations
    route_stops = route_stops.merge(
        stops_df[["STOP_ID", "NAME", "LAT", "LON"]],
        on="STOP_ID"
    )

    # Sort by route and sequence
    route_stops = route_stops.sort_values(["ROUTE_ID", "stop_sequence"])

    return route_stops

route_stops_df = create_route_stop_mapping()
This function creates a comprehensive mapping of transit routes and their associated stops by combining data from multiple GTFS tables. Here’s the step-by-step process:
- First Merge Operation:
- Combines
stop_times_dfwithtrips_dfusingTRIP_IDas the joining key - From
trips_df, onlyTRIP_IDandROUTE_IDcolumns are selected - The
leftjoin preserves all records fromstop_times_df - This step associates each stop time with its corresponding route
- Combines
- Second Merge Operation:
- Joins the previous result with
stops_df - Selects essential stop information:
STOP_ID,NAME,LAT,LON - Links each stop’s geographic coordinates and name to the route data
- Joins the previous result with
- Data Organization:
- Sorts the resulting DataFrame by
ROUTE_IDandstop_sequence - This ordering ensures stops are arranged in the correct sequence along each route
- Essential for correctly drawing route lines on the map
- Sorts the resulting DataFrame by
The final route_stops_df contains a complete dataset where each row represents a stop on a route with:
- Route identification
- Stop location (latitude/longitude)
- Stop name
- Sequential order of stops
Data Validation
Let’s add some basic validation to ensure our data is ready for mapping:
def validate_transit_data():
    """Validate processed transit data"""
    validation_results = {
        "routes": len(routes_df) > 0,
        "stops": len(stops_df) > 0,
        "trips": len(trips_df) > 0,
        "stop_times": len(stop_times_df) > 0
    }

    # Check for missing coordinates
    stops_with_coords = stops_df[
        stops_df["LAT"].notna() &
        stops_df["LON"].notna()
    ]
    validation_results["valid_coordinates"] = len(stops_with_coords) == len(stops_df)

    return validation_results

validation = validate_transit_data()
print("Data Validation Results:")
for key, value in validation.items():
    print(f"{key}: {'✓' if value else '✗'}")
This function performs basic validation checks on GTFS (General Transit Feed Specification) transit data:
- Data Presence Check
- Creates a dictionary
validation_resultsthat verifies each required DataFrame has data: routes_df: Contains route informationstops_df: Contains stop locationstrips_df: Contains trip schedulesstop_times_df: Contains timing data- Each check returns
Trueif the DataFrame has at least one row
- Creates a dictionary
- Coordinate Validation
- Filters
stops_dfto find stops with valid latitude and longitude - Uses
notna()to check for non-null values in both LAT and LON columns - Compares count of valid coordinates against total stops
- Returns
Trueonly if all stops have coordinates
- Filters
- Results Display
- Calls the validation function and stores results
- Prints each validation check with a checkmark (✓) for pass or x (✗) for fail
This processed data will serve as the foundation for our mapping visualization in the next section. We’ll use the cleaned route and stop information to create an interactive map showing MARTA’s transit network.
Creating Interactive Maps
Now that we’ve processed our GTFS data, let’s create an interactive map visualization using Folium.
def create_transit_map(center, stops_df, route_stops_df, trips_df, stop_times_df, routes_df, zoom=10):
    """Create complete transit map with all elements"""
    # Create base map
    map_obj = folium.Map(location=center, zoom_start=zoom)

    # Add stops
    marker_cluster = MarkerCluster().add_to(map_obj)
    for idx, stop in stops_df.iterrows():
        folium.Marker(
            location=[stop['LAT'], stop['LON']],
            popup=stop['NAME'],
            icon=folium.Icon(color='blue', icon='info-sign')
        ).add_to(marker_cluster)

    # Add routes with type-based colors
    for route_id in route_stops_df['ROUTE_ID'].unique():
        # Get route type from routes_df
        route_type = routes_df[routes_df['ROUTE_ID'] == route_id]['route_type'].iloc[0]
        route_color = ROUTE_TYPE_COLORS.get(route_type, '#3388ff')  # Default blue if type not found

        route_trips = trips_df[trips_df['ROUTE_ID'] == route_id]
        route_trips = route_trips.drop_duplicates(subset=['ROUTE_ID', 'direction_id'])

        for _, trip in route_trips.iterrows():
            stop_sequence = stop_times_df[
                stop_times_df['TRIP_ID'] == trip['TRIP_ID']
            ].sort_values('stop_sequence')

            coordinates = []
            for _, stop_time in stop_sequence.iterrows():
                stop = stops_df[stops_df['STOP_ID'] == stop_time['STOP_ID']]
                if not stop.empty:
                    coordinates.append([
                        float(stop['LAT'].iloc[0]),
                        float(stop['LON'].iloc[0])
                    ])

            if coordinates:
                folium.PolyLine(
                    coordinates,
                    weight=3,
                    color=route_color,
                    popup=f"Route {route_id} ({ROUTE_TYPES[route_type]})"
                ).add_to(map_obj)

    # Update legend to show route types
    legend_html = f'''
    <div style="position: fixed;
                bottom: 50px; right: 50px;
                width: 200px;
                height: auto;
                background-color: white;
                border: 2px solid grey;
                z-index: 9999;
                opacity: 0.8;
                padding: 10px">
        <p style="margin: 0; font-weight: bold;">Transit Map</p>
        <hr style="margin: 5px 0;">
        <p style="margin: 5px 0;">
            <i class="fa fa-map-marker" style="color: blue;"></i> Stops
        </p>
        {''.join([f'<p style="margin: 5px 0;"><i class="fa fa-line-chart" style="color: {color};"></i> {ROUTE_TYPES[rtype]}</p>'
                  for rtype, color in ROUTE_TYPE_COLORS.items()])}
    </div>
    '''
    map_obj.get_root().html.add_child(folium.Element(legend_html))

    return map_obj

# Create complete map
map = create_transit_map(MAP_CENTER, stops_df, route_stops_df, trips_df, stop_times_df, routes_df, MAP_ZOOM)
map
The create_transit_map function creates an interactive transit map using Folium with three main components:
- Base Map Setup
map_obj = folium.Map(location=center, zoom_start=zoom)
- Creates a base map centered at the specified coordinates
- Sets initial zoom level (default=10)
- Stop Markers
   # Add stops
    marker_cluster = MarkerCluster().add_to(map_obj)
    for idx, stop in stops_df.iterrows():
        folium.Marker(
            location=[stop['LAT'], stop['LON']],
            popup=stop['NAME'],
            icon=folium.Icon(color='blue', icon='info-sign')
        ).add_to(marker_cluster)
- Uses MarkerCluster for efficient handling of multiple markers
- Adds blue markers for each transit stop
- Each marker shows the stop name in a popup when clicked
- Route Lines
    # Add routes with type-based colors
    for route_id in route_stops_df['ROUTE_ID'].unique():
        # Get route type from routes_df
        route_type = routes_df[routes_df['ROUTE_ID'] == route_id]['route_type'].iloc[0]
        route_color = ROUTE_TYPE_COLORS.get(route_type, '#3388ff')  # Default blue if type not found

        route_trips = trips_df[trips_df['ROUTE_ID'] == route_id]
        route_trips = route_trips.drop_duplicates(subset=['ROUTE_ID', 'direction_id'])

        for _, trip in route_trips.iterrows():
            stop_sequence = stop_times_df[
                stop_times_df['TRIP_ID'] == trip['TRIP_ID']
            ].sort_values('stop_sequence')

            coordinates = []
            for _, stop_time in stop_sequence.iterrows():
                stop = stops_df[stops_df['STOP_ID'] == stop_time['STOP_ID']]
                if not stop.empty:
                    coordinates.append([
                        float(stop['LAT'].iloc[0]),
                        float(stop['LON'].iloc[0])
                    ])

            if coordinates:
                folium.PolyLine(
                    coordinates,
                    weight=3,
                    color=route_color,
                    popup=f"Route {route_id} ({ROUTE_TYPES[route_type]})"
                ).add_to(map_obj)
- Processes each unique route in the system
- Color-codes routes based on their type (bus, rail, etc.)
- For each route:
- Gets route type and corresponding color
- Finds all trips for the route
- Creates a line connecting stops in sequence
- Adds route type information to line popup
- Legend
    # Update legend to show route types
    legend_html = f'''
    <div style="position: fixed;
                bottom: 50px; right: 50px;
                width: 200px;
                height: auto;
                background-color: white;
                border: 2px solid grey;
                z-index: 9999;
                opacity: 0.8;
                padding: 10px">
        <p style="margin: 0; font-weight: bold;">Transit Map</p>
        <hr style="margin: 5px 0;">
        <p style="margin: 5px 0;">
            <i class="fa fa-map-marker" style="color: blue;"></i> Stops
        </p>
        {''.join([f'<p style="margin: 5px 0;"><i class="fa fa-line-chart" style="color: {color};"></i> {ROUTE_TYPES[rtype]}</p>'
                  for rtype, color in ROUTE_TYPE_COLORS.items()])}
    </div>
    '''
    map_obj.get_root().html.add_child(folium.Element(legend_html))

    return map_obj
- Adds a fixed-position legend in bottom-right corner
- Shows stop marker symbol
- Lists all route types with their corresponding colors
- Uses Font Awesome icons for visual representation
- Create and Display the Map
map = create_transit_map(MAP_CENTER, stops_df, route_stops_df, trips_df, stop_times_df, routes_df, MAP_ZOOM)
map
The function takes these parameters:
center: Map center coordinates [lat, lon]stops_df: DataFrame containing stop informationroute_stops_df: DataFrame linking routes to stopstrips_df: DataFrame containing trip informationstop_times_df: DataFrame with stop sequence dataroutes_df: DataFrame with route type informationzoom: Initial zoom level (optional)
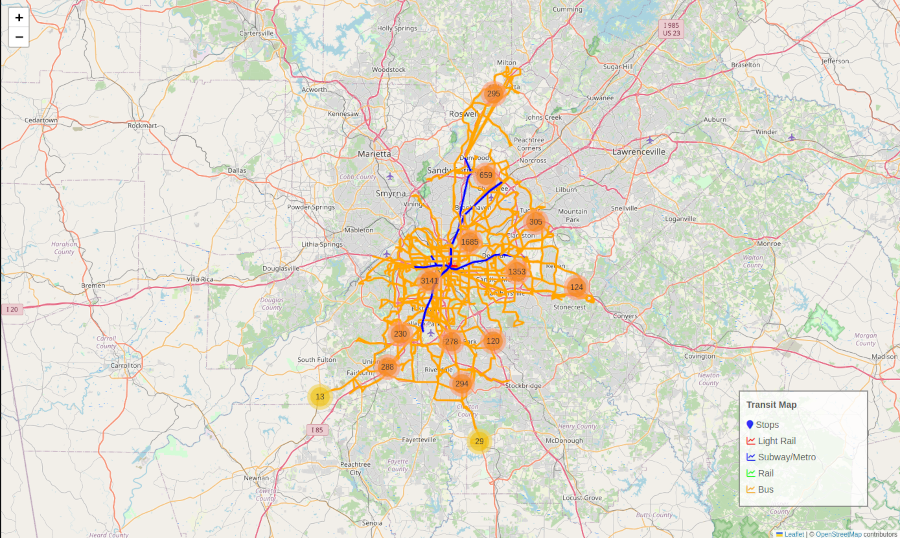
The final map combines all elements into an interactive visualization of the transit system.
After running the notebook you should get a map that looks like: